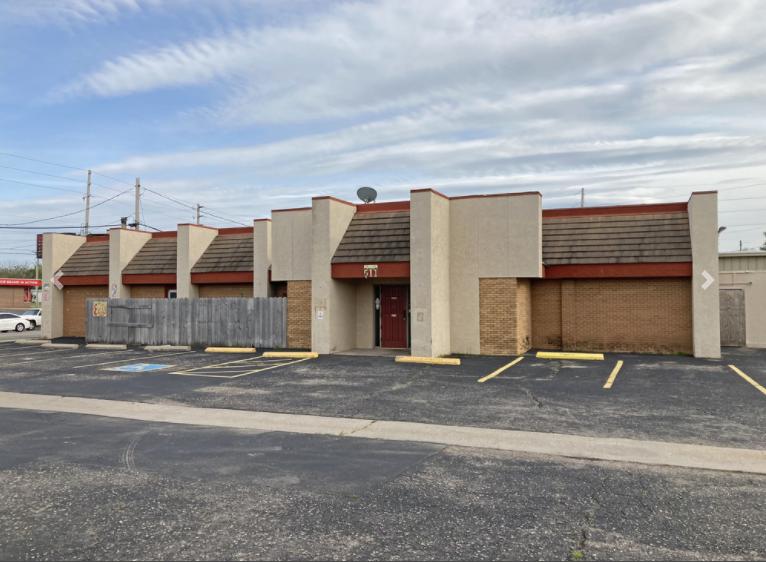
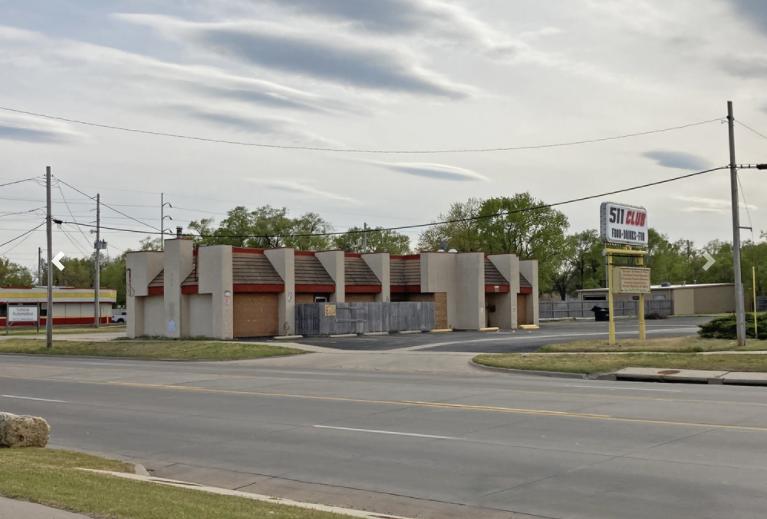
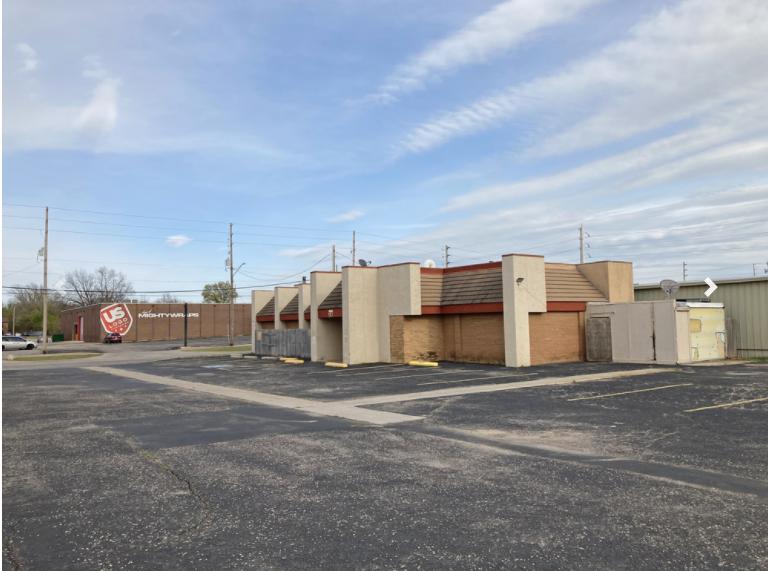
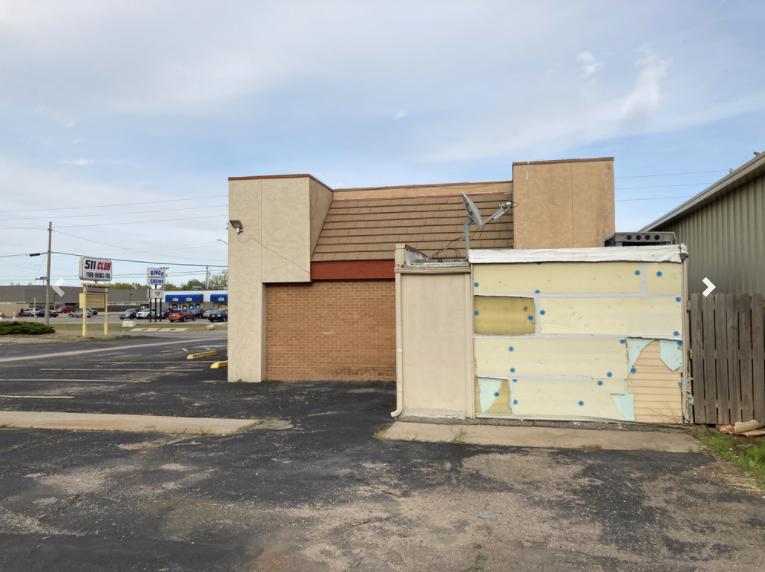
1-Mile | 3-Miles | 5-Miles | ||
---|---|---|---|---|
Total Population | 10,667 | 77,226 | 194,386 | |
Population Median Age | 39 | 38 | 37 | |
Population by Age | 0-9 Yrs | 1384 (12%) | 9773 (12%) | 27477 (14%) |
10-19 Yrs | 1190 (11%) | 9618 (12%) | 25859 (13%) | |
20-29 Yrs | 1652 (15%) | 12953 (16%) | 28935 (14%) | |
30-39 Yrs | 1355 (12%) | 10513 (13%) | 25725 (13%) | |
40-49 Yrs | 1406 (13%) | 8856 (11%) | 22087 (11%) | |
50-59 Yrs | 1256 (11%) | 9190 (11%) | 24453 (12%) | |
60-69 Yrs | 1371 (12%) | 9183 (11%) | 22183 (11%) | |
70+ Yrs | 1053 (9%) | 7140 (9%) | 17667 (9%) | |
Median HH Income | $41,229 | $44,922 | $47,245 | |
Total Household Income | < 24K | 1375 (28%) | 8395 (25%) | 20168 (25%) |
25-49K | 1560 (32%) | 10010 (30%) | 21131 (26%) | |
50-74K | 879 (18%) | 6463 (19%) | 14840 (18%) | |
75-99K | 427 (8%) | 3323 (10%) | 8460 (10%) | |
100-199K | 505 (10%) | 4326 (13%) | 11816 (15%) | |
200K+ | 19 (0%) | 546 (1%) | 1852 (2%) | |
Highest Education Level | No Diploma | 1092 | 6393 | 17712 |
Diploma or GED | 2612 | 15509 | 36910 | |
Some College | 1880 | 12766 | 31227 | |
Assoc. Degree | 542 | 3776 | 10013 | |
Bachelors Degree | 819 | 8620 | 20972 | |
Higher Degree | 327 | 3875 | 10224 | |
Total Housing Units | 5,296 | 37,140 | 88,713 | |
--Owner-Occupied | 2,477 | 16,607 | 43,113 | |
--Renter-Occupied | 2,288 | 16,454 | 35,153 | |
Owner-Occupied Values | < 100K | 1615 | 7730 | 18480 |
100-199K | 801 | 6804 | 18099 | |
200-299K | 48 | 1294 | 4364 | |
300-399K | 12 | 296 | 1106 | |
400-499K | 0 | 191 | 347 | |
500K+ | 0 | 292 | 717 | |
Total Working Age Population | 8,700 | 61,684 | 150,892 | |
In Work Force | 5,617 | 41,037 | 99,309 | |
Not In Work Force | 3,083 | 20,647 | 51,583 | |
Workforce Employed | 5,305 | 38,946 | 93,136 | |
Workforce Unemployed | 312 | 1,995 | 5,982 | |
Civlian Workforce | 5,617 | 40,941 | 99,118 | |
Military Workforce | 0 | 96 | 191 | |
Total Households | 4,765 | 33,062 | 78,266 | |
Family Households | 2,480 | 17,161 | 44,577 | |
Non-Family Households | 2,285 | 15,900 | 33,690 | |
Married Couple | 1,574 | 11,579 | 30,807 | |
Other Family | 906 | 5,582 | 13,770 | |
Married w/Child | 495 | 4,431 | 12,362 | |
Single Male w/Child | 72 | 825 | 2,273 | |
Single Female w/Child | 328 | 2,239 | 5,882 |
Population Change Last Two Decades - Plus Projection
2000 | % | 2010 | % | 2020 | % | 2030 | |
---|---|---|---|---|---|---|---|
Kansas | 2,688,418 | +6 | 2,853,118 | +5 | 2,988,194 | +5 | 3,140,008 |
Sedgwick County | 452,869 | +10 | 498,365 | +6 | 530,232 | +7 | 565,494 |
Total Working Age Population:
Total Households:
Total Working Age Population:
Total Households:
Total Working Age Population:
Total Households: