Office Space
4019 21st Avenue West Seattle, WA 98199
4019 21st Avenue West Seattle, WA 98199

Details & Description
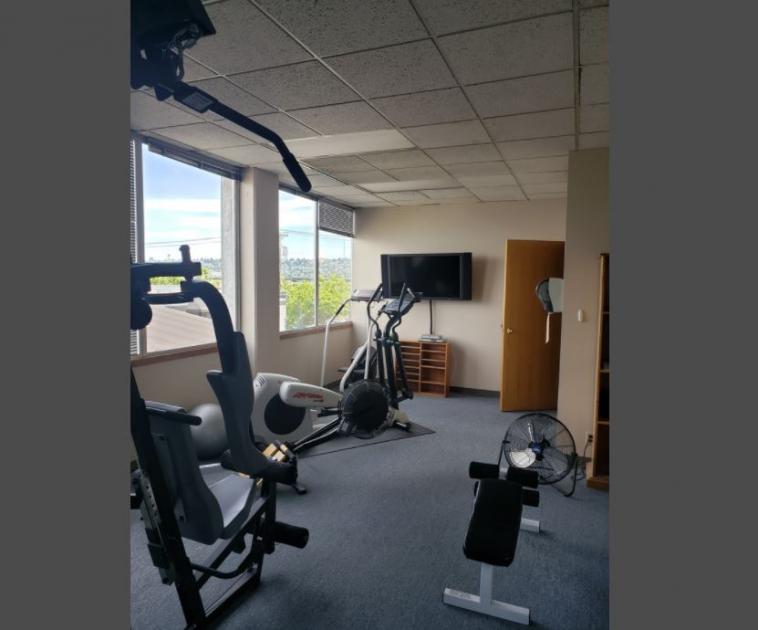
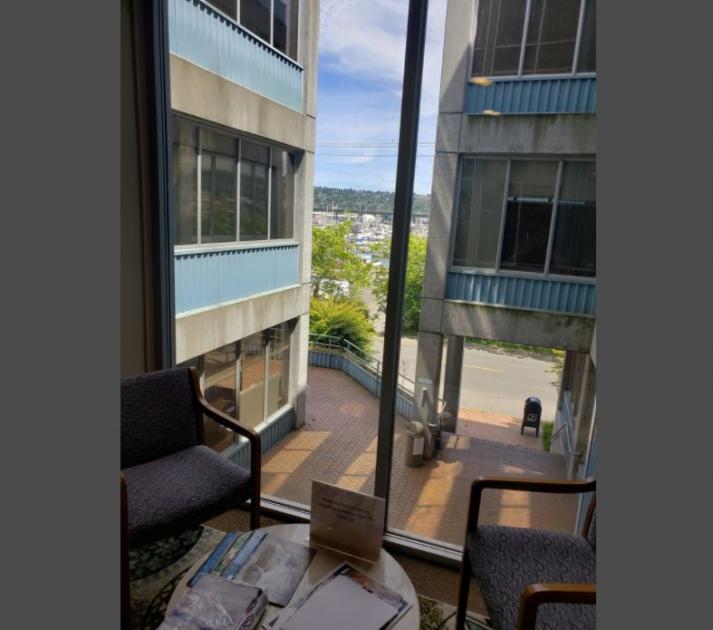
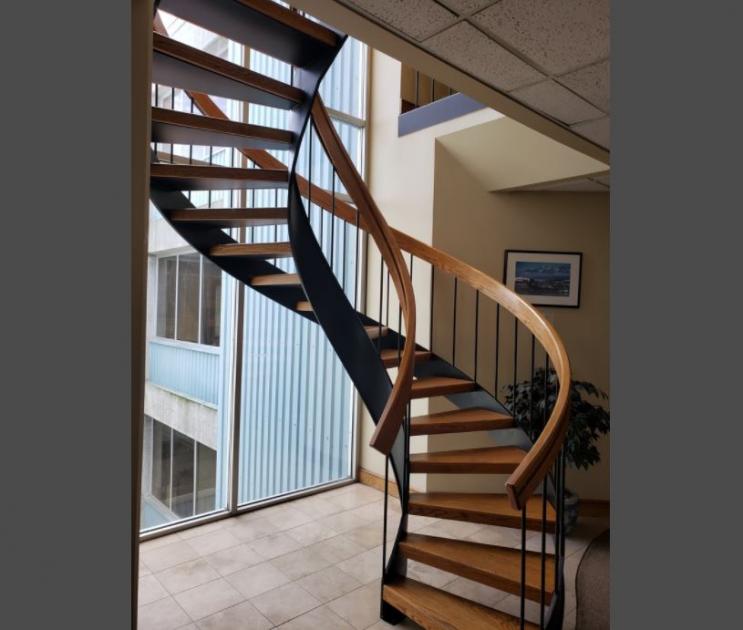
Additional Photos

Listing Agents

Arie Salomon
O: 425-586-5636
M: 425-246-9280
asalomon@nai-psp.com
O: 425-586-5636
M: 425-246-9280
asalomon@nai-psp.com

Bob Swain
O: 425-586-5622
M: 206-794-0443
bswain@nai-psp.com
O: 425-586-5622
M: 206-794-0443
bswain@nai-psp.com

Noah Swain
O: 425-586-5621
M: 206-261-0493
nswain@nai-psp.com
O: 425-586-5621
M: 206-261-0493
nswain@nai-psp.com
While we strive to provide the most accurate information, all listing information, and demographic data, is provided by third-parties. As such, MyEListing will not be responsible for the accuracy of the information. It is strongly recommended that you verify all information with the listing agent, and any relevant agencies, prior to making any decisions.


