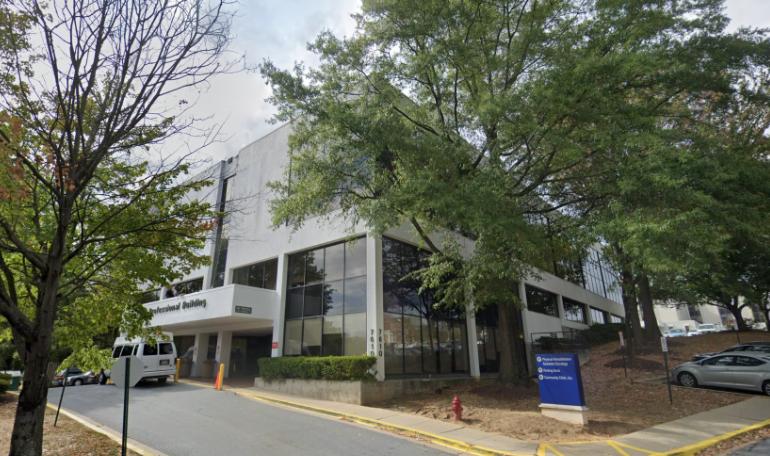
This unit is within the Washington Adventist Medical Center Building. The property is built out as a functioning medical facility ideal for a medical or dental practice. Three exam rooms with the possibility of a 4th room.
Highlights
Condo is approx. 1,017 SF
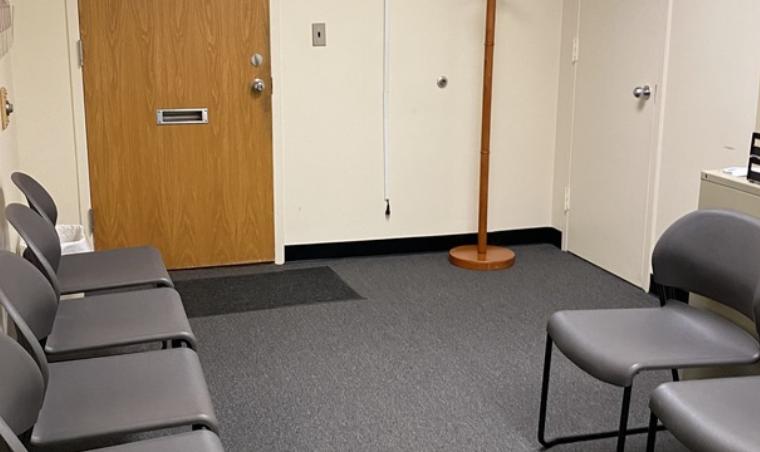
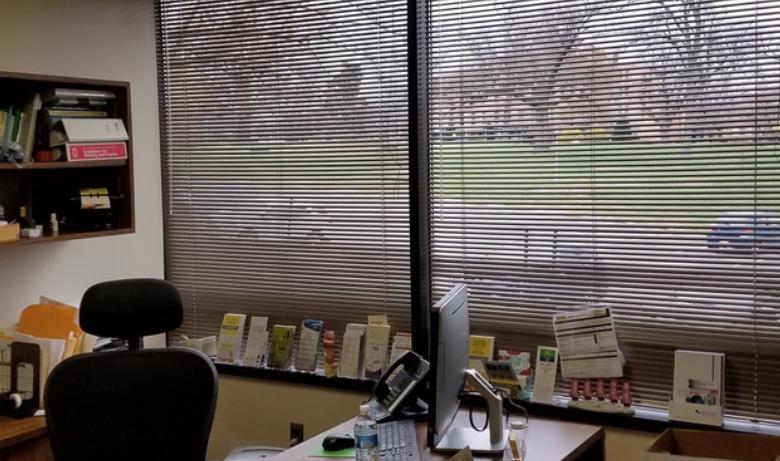
Fully built-out medical space
Includes reception area, storage file room, three exam rooms with sinks, kitchen area
Part of the Washington Adventist Medical Center
Ideal for medical or dental office, as well as other professional uses
Potential for additional exam room
Condo fee is $453.95 per month
No part of this information may be copied, reproduced, repurposed, or screen-captured for any commercial purpose without prior written authorization from MyEListing.
While we strive to provide the most accurate information, all listing information, and demographic data, is provided by third-parties. As such, MyEListing will not be responsible for the accuracy of the information. It is strongly recommended that you verify all information with the listing agent, and any relevant agencies, prior to making any decisions.
What is the building size of this Office property in Takoma Park, MD?
The size of the building/unit at 7610 Carroll Avenue in Takoma Park is 1,017 square feet
What kind of Office is the propery at 7610 Carroll Avenue?
The property at 7610 Carroll Avenue Takoma Park, MD 20912 is listed as a Medical Office property
What is the population within 1 mile of 7610 Carroll Avenue in Takoma Park?
The population within 1 mile of 7610 Carroll Avenue Takoma Park, MD 20912 is 35,689 people.
Who do I contact for questions about 7610 Carroll Avenue?
You should contact the listing agent,
Steve Catalano, for any details regarding this commercial listing.