Commercial Land
12626 White Hills Rd Willow Beach, AZ 86445
12626 White Hills Rd Willow Beach, AZ 86445
Details & Description
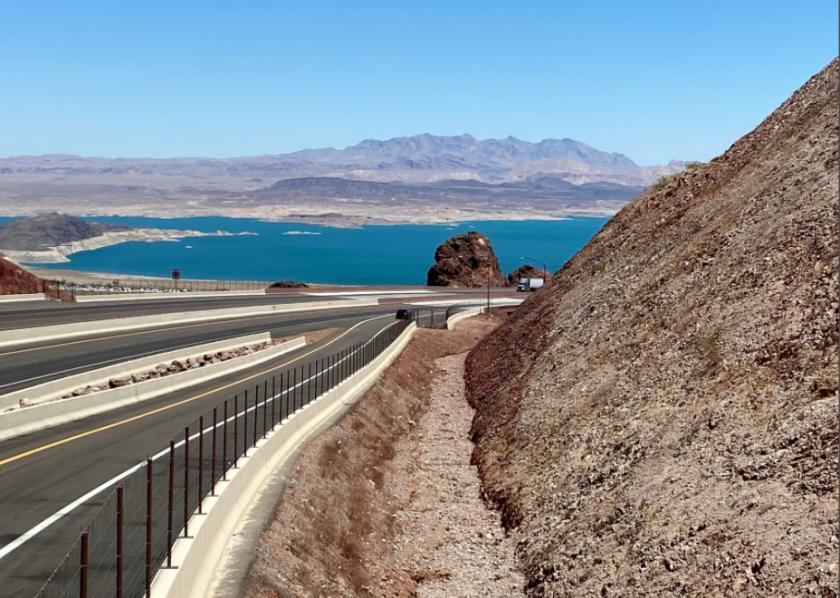
Additional Photos


Listing Agents

Christopher Lewis
O: 602-393-6617
M: 602-380-8581
chris.lewis@naihorizon.com
O: 602-393-6617
M: 602-380-8581
chris.lewis@naihorizon.com

Erik Sexton
O: 702-383-3383
M: 702-534-1711
erik.sexton@naiexcel.com
O: 702-383-3383
M: 702-534-1711
erik.sexton@naiexcel.com
While we strive to provide the most accurate information, all listing information, and demographic data, is provided by third-parties. As such, MyEListing will not be responsible for the accuracy of the information. It is strongly recommended that you verify all information with the listing agent, and any relevant agencies, prior to making any decisions.


