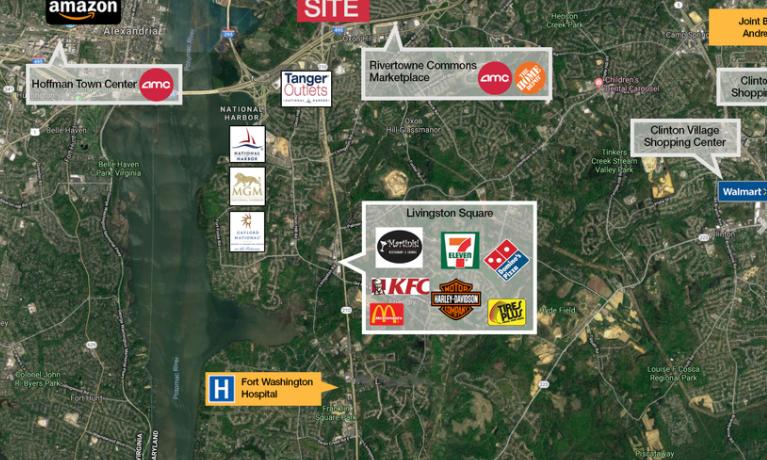
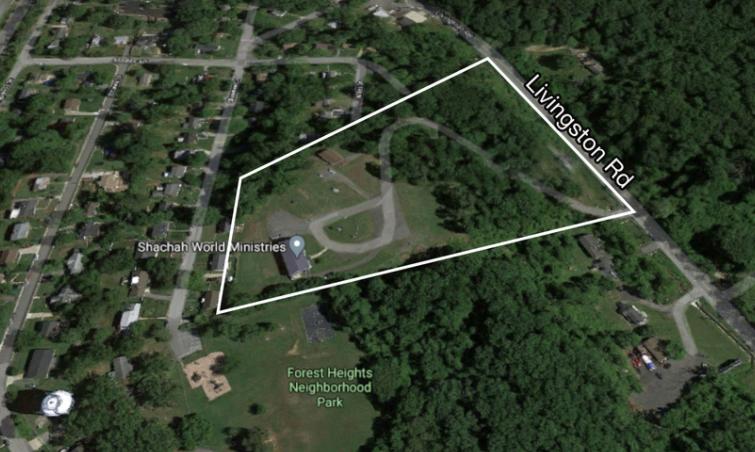
1-Mile | 3-Miles | 5-Miles | ||
---|---|---|---|---|
Total Population | 16,275 | 140,917 | 400,173 | |
Population Median Age | 34 | 36 | 37 | |
Population by Age | 0-9 Yrs | 2647 (16%) | 21725 (15%) | 52290 (13%) |
10-19 Yrs | 1853 (11%) | 16186 (11%) | 38265 (9%) | |
20-29 Yrs | 2866 (17%) | 22829 (16%) | 63939 (15%) | |
30-39 Yrs | 2822 (17%) | 20753 (14%) | 71831 (17%) | |
40-49 Yrs | 1704 (10%) | 17506 (12%) | 50674 (12%) | |
50-59 Yrs | 1784 (10%) | 17533 (12%) | 50528 (12%) | |
60-69 Yrs | 1698 (10%) | 14251 (10%) | 41096 (10%) | |
70+ Yrs | 901 (5%) | 10133 (7%) | 31549 (7%) | |
Median HH Income | $58,174 | $63,773 | $83,463 | |
Total Household Income | < 24K | 892 (15%) | 11100 (20%) | 26605 (16%) |
25-49K | 1557 (26%) | 10710 (19%) | 24769 (14%) | |
50-74K | 1217 (20%) | 8577 (15%) | 24160 (14%) | |
75-99K | 1107 (18%) | 7376 (13%) | 21330 (12%) | |
100-199K | 893 (15%) | 11395 (21%) | 46331 (27%) | |
200K+ | 189 (3%) | 4659 (8%) | 22316 (13%) | |
Highest Education Level | No Diploma | 2295 | 11113 | 26706 |
Diploma or GED | 3627 | 28691 | 63848 | |
Some College | 2534 | 21828 | 52314 | |
Assoc. Degree | 599 | 5422 | 13910 | |
Bachelors Degree | 1053 | 13471 | 61575 | |
Higher Degree | 543 | 12287 | 66206 | |
Total Housing Units | 6,582 | 59,860 | 182,409 | |
--Owner-Occupied | 1,983 | 20,480 | 70,796 | |
--Renter-Occupied | 3,872 | 33,337 | 94,714 | |
Owner-Occupied Values | < 100K | 132 | 1037 | 2430 |
100-199K | 538 | 2963 | 6571 | |
200-299K | 886 | 6460 | 16464 | |
300-399K | 356 | 4405 | 14096 | |
400-499K | 38 | 1021 | 6246 | |
500K+ | 33 | 4593 | 24990 | |
Total Working Age Population | 12,548 | 108,896 | 323,340 | |
In Work Force | 9,151 | 75,411 | 230,943 | |
Not In Work Force | 3,397 | 33,485 | 92,397 | |
Workforce Employed | 8,294 | 65,433 | 208,732 | |
Workforce Unemployed | 857 | 7,646 | 15,974 | |
Civlian Workforce | 9,151 | 73,079 | 224,707 | |
Military Workforce | 0 | 2,332 | 6,237 | |
Total Households | 5,855 | 53,817 | 165,511 | |
Family Households | 3,552 | 30,838 | 86,173 | |
Non-Family Households | 2,303 | 22,979 | 79,338 | |
Married Couple | 1,554 | 14,155 | 50,747 | |
Other Family | 1,997 | 16,683 | 35,425 | |
Married w/Child | 555 | 5,116 | 18,130 | |
Single Male w/Child | 289 | 1,594 | 3,212 | |
Single Female w/Child | 815 | 7,198 | 14,168 |
Population Change Last Two Decades - Plus Projection
2000 | % | 2010 | % | 2020 | % | 2030 | |
---|---|---|---|---|---|---|---|
District of Columbia | 572,059 | +5 | 601,723 | +21 | 729,501 | +15 | 842,154 |
Maryland | 5,296,486 | +9 | 5,773,552 | +6 | 6,141,900 | +6 | 6,518,750 |
Prince Georges County | 801,515 | +8 | 863,420 | +6 | 916,150 | +4 | 952,950 |
Virginia | 7,078,515 | +13 | 8,001,024 | +8 | 8,655,021 | +8 | 9,331,666 |
Arlington County | 189,453 | +10 | 207,627 | +20 | 249,298 | +10 | 274,339 |
Fairfax County | 969,749 | +12 | 1,081,726 | +7 | 1,162,504 | +7 | 1,244,025 |
Alexandria city | 128,283 | +9 | 139,966 | +19 | 166,261 | +10 | 182,067 |
Total Working Age Population:
Total Households:
Total Working Age Population:
Total Households:
Total Working Age Population:
Total Households: