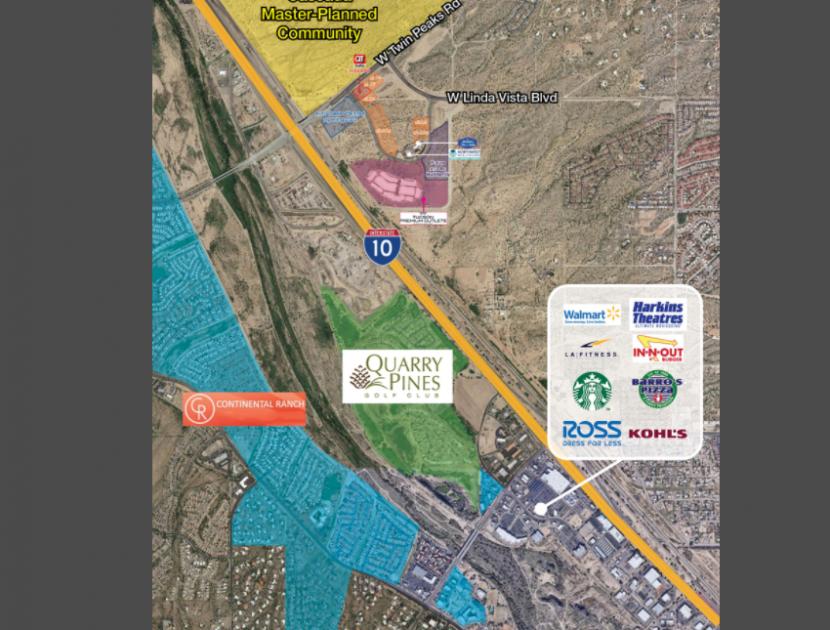
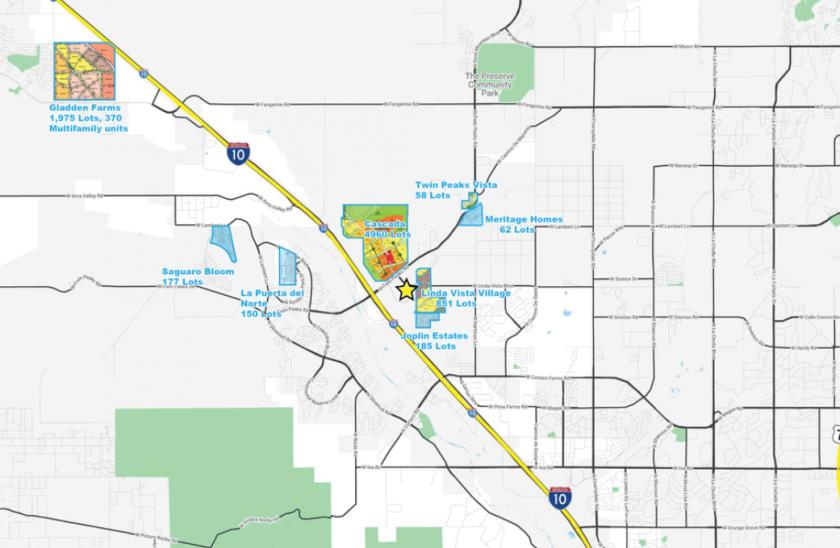
1-Mile | 3-Miles | 5-Miles | ||
---|---|---|---|---|
Total Population | 2,015 | 30,739 | 70,191 | |
Population Median Age | 37 | 38 | 39 | |
Population by Age | 0-9 Yrs | 326 (16%) | 4136 (13%) | 9109 (12%) |
10-19 Yrs | 272 (13%) | 4221 (13%) | 8594 (12%) | |
20-29 Yrs | 199 (9%) | 3844 (12%) | 9516 (13%) | |
30-39 Yrs | 305 (15%) | 4004 (13%) | 9238 (13%) | |
40-49 Yrs | 278 (13%) | 4079 (13%) | 8875 (12%) | |
50-59 Yrs | 226 (11%) | 3647 (11%) | 8954 (12%) | |
60-69 Yrs | 223 (11%) | 3605 (11%) | 8267 (11%) | |
70+ Yrs | 187 (9%) | 3202 (10%) | 7637 (10%) | |
Median HH Income | $97,152 | $84,771 | $79,104 | |
Total Household Income | < 24K | 34 (4%) | 876 (7%) | 2162 (8%) |
25-49K | 79 (11%) | 1729 (15%) | 4567 (17%) | |
50-74K | 114 (16%) | 2245 (20%) | 5687 (21%) | |
75-99K | 128 (18%) | 1791 (16%) | 4622 (17%) | |
100-199K | 292 (42%) | 3939 (35%) | 8105 (30%) | |
200K+ | 34 (4%) | 520 (4%) | 1206 (4%) | |
Highest Education Level | No Diploma | 77 | 1077 | 2344 |
Diploma or GED | 190 | 3763 | 9126 | |
Some College | 349 | 5057 | 12790 | |
Assoc. Degree | 82 | 2293 | 5265 | |
Bachelors Degree | 338 | 4978 | 10900 | |
Higher Degree | 284 | 3077 | 6763 | |
Total Housing Units | 716 | 11,910 | 28,022 | |
--Owner-Occupied | 619 | 8,946 | 20,636 | |
--Renter-Occupied | 62 | 2,153 | 5,713 | |
Owner-Occupied Values | < 100K | 16 | 312 | 837 |
100-199K | 175 | 2927 | 8272 | |
200-299K | 306 | 3902 | 7580 | |
300-399K | 80 | 1292 | 2486 | |
400-499K | 19 | 266 | 762 | |
500K+ | 23 | 248 | 700 | |
Total Working Age Population | 1,532 | 24,063 | 55,848 | |
In Work Force | 1,000 | 15,777 | 37,159 | |
Not In Work Force | 531 | 8,286 | 18,689 | |
Workforce Employed | 931 | 15,044 | 35,153 | |
Workforce Unemployed | 57 | 620 | 1,744 | |
Civlian Workforce | 988 | 15,663 | 36,897 | |
Military Workforce | 12 | 114 | 262 | |
Total Households | 681 | 11,099 | 26,349 | |
Family Households | 570 | 8,496 | 19,052 | |
Non-Family Households | 111 | 2,603 | 7,297 | |
Married Couple | 477 | 6,875 | 15,065 | |
Other Family | 93 | 1,621 | 3,988 | |
Married w/Child | 196 | 2,567 | 5,503 | |
Single Male w/Child | 5 | 306 | 583 | |
Single Female w/Child | 45 | 588 | 1,377 |
Population Change Last Two Decades - Plus Projection
2000 | % | 2010 | % | 2020 | % | 2030 | |
---|---|---|---|---|---|---|---|
Arizona | 5,130,632 | +25 | 6,392,017 | +14 | 7,286,100 | +14 | 8,284,900 |
Pima County | 843,746 | +16 | 980,263 | +7 | 1,050,900 | +7 | 1,129,200 |
Total Working Age Population:
Total Households:
Total Working Age Population:
Total Households:
Total Working Age Population:
Total Households: