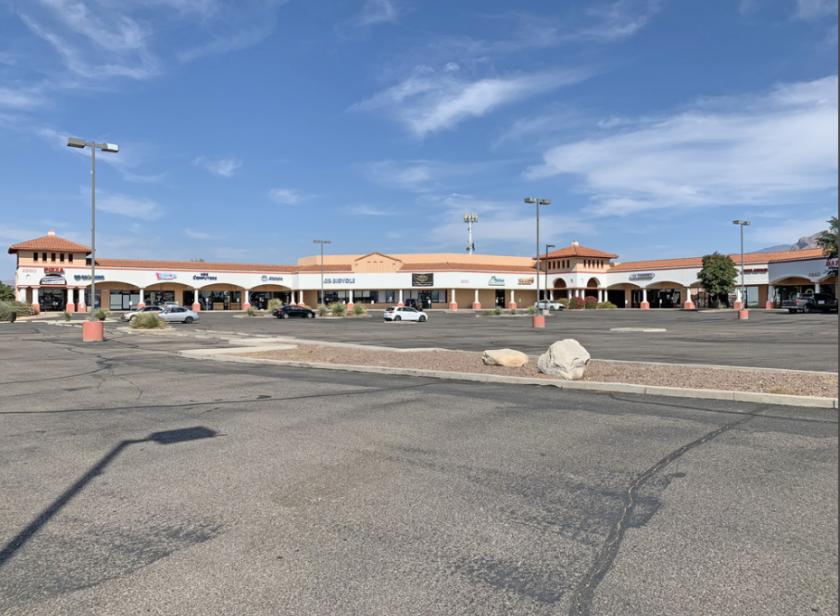
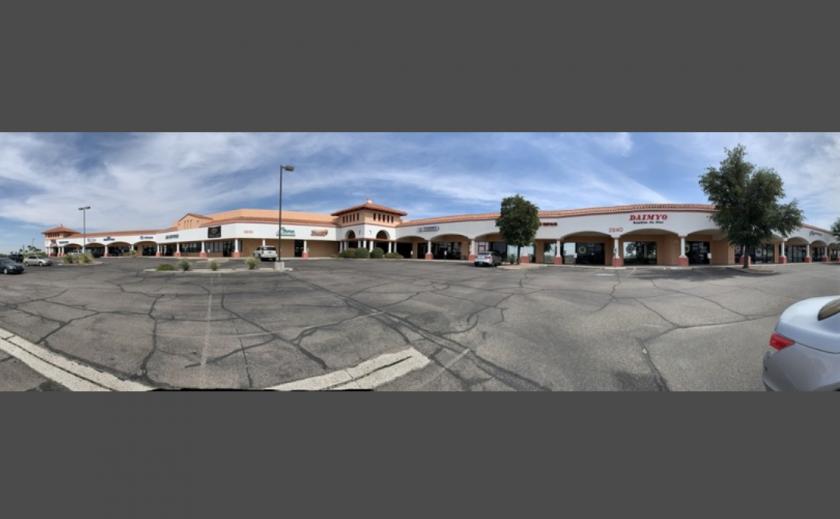
1-Mile | 3-Miles | 5-Miles | ||
---|---|---|---|---|
Total Population | 11,667 | 68,082 | 138,140 | |
Population Median Age | 39 | 41 | 41 | |
Population by Age | 0-9 Yrs | 1207 (10%) | 7458 (10%) | 15343 (11%) |
10-19 Yrs | 1132 (9%) | 7365 (10%) | 15344 (11%) | |
20-29 Yrs | 2639 (22%) | 11370 (16%) | 21709 (15%) | |
30-39 Yrs | 1148 (9%) | 8130 (11%) | 15836 (11%) | |
40-49 Yrs | 1423 (12%) | 7455 (10%) | 15512 (11%) | |
50-59 Yrs | 1374 (11%) | 8762 (12%) | 17806 (12%) | |
60-69 Yrs | 1503 (12%) | 8764 (12%) | 18173 (13%) | |
70+ Yrs | 1241 (10%) | 8777 (12%) | 18418 (13%) | |
Median HH Income | $55,200 | $61,947 | $60,434 | |
Total Household Income | < 24K | 881 (17%) | 4373 (15%) | 10084 (17%) |
25-49K | 1414 (27%) | 6707 (23%) | 13473 (23%) | |
50-74K | 1226 (23%) | 5806 (20%) | 10886 (19%) | |
75-99K | 694 (13%) | 4055 (14%) | 7548 (13%) | |
100-199K | 814 (15%) | 6042 (21%) | 12007 (21%) | |
200K+ | 81 (1%) | 1055 (3%) | 2851 (5%) | |
Highest Education Level | No Diploma | 713 | 3712 | 7410 |
Diploma or GED | 1530 | 10226 | 20804 | |
Some College | 2534 | 13396 | 25459 | |
Assoc. Degree | 891 | 5066 | 9560 | |
Bachelors Degree | 1218 | 9075 | 18811 | |
Higher Degree | 851 | 5956 | 14069 | |
Total Housing Units | 5,503 | 30,173 | 62,163 | |
--Owner-Occupied | 2,378 | 17,670 | 37,159 | |
--Renter-Occupied | 2,732 | 10,368 | 19,690 | |
Owner-Occupied Values | < 100K | 77 | 2024 | 5502 |
100-199K | 1237 | 7248 | 12725 | |
200-299K | 754 | 5286 | 10176 | |
300-399K | 239 | 1935 | 4673 | |
400-499K | 56 | 661 | 1877 | |
500K+ | 15 | 515 | 2206 | |
Total Working Age Population | 9,861 | 56,385 | 113,917 | |
In Work Force | 6,936 | 35,995 | 71,265 | |
Not In Work Force | 2,925 | 20,390 | 42,651 | |
Workforce Employed | 6,345 | 33,586 | 66,322 | |
Workforce Unemployed | 579 | 2,250 | 4,519 | |
Civlian Workforce | 6,925 | 35,837 | 70,841 | |
Military Workforce | 11 | 158 | 425 | |
Total Households | 5,111 | 28,037 | 56,849 | |
Family Households | 3,038 | 17,082 | 34,996 | |
Non-Family Households | 2,073 | 10,956 | 21,853 | |
Married Couple | 1,952 | 12,208 | 25,480 | |
Other Family | 1,087 | 4,874 | 9,516 | |
Married w/Child | 624 | 4,159 | 8,773 | |
Single Male w/Child | 168 | 662 | 1,466 | |
Single Female w/Child | 416 | 1,560 | 2,984 |
Population Change Last Two Decades - Plus Projection
2000 | % | 2010 | % | 2020 | % | 2030 | |
---|---|---|---|---|---|---|---|
Arizona | 5,130,632 | +25 | 6,392,017 | +14 | 7,286,100 | +14 | 8,284,900 |
Pima County | 843,746 | +16 | 980,263 | +7 | 1,050,900 | +7 | 1,129,200 |
Total Working Age Population:
Total Households:
Total Working Age Population:
Total Households:
Total Working Age Population:
Total Households: