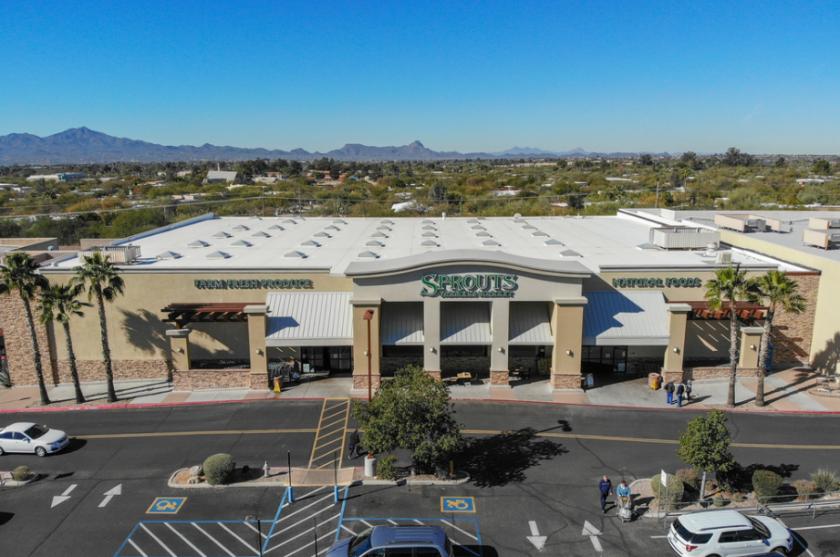
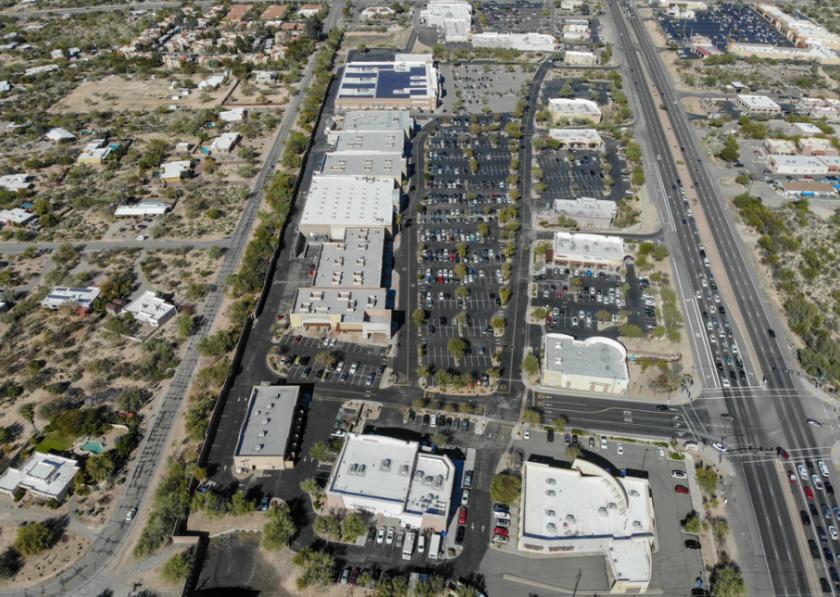
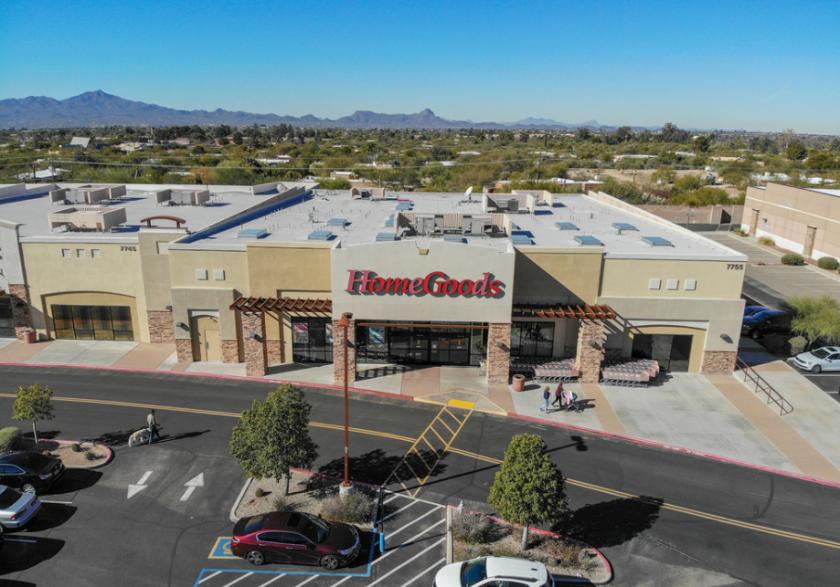
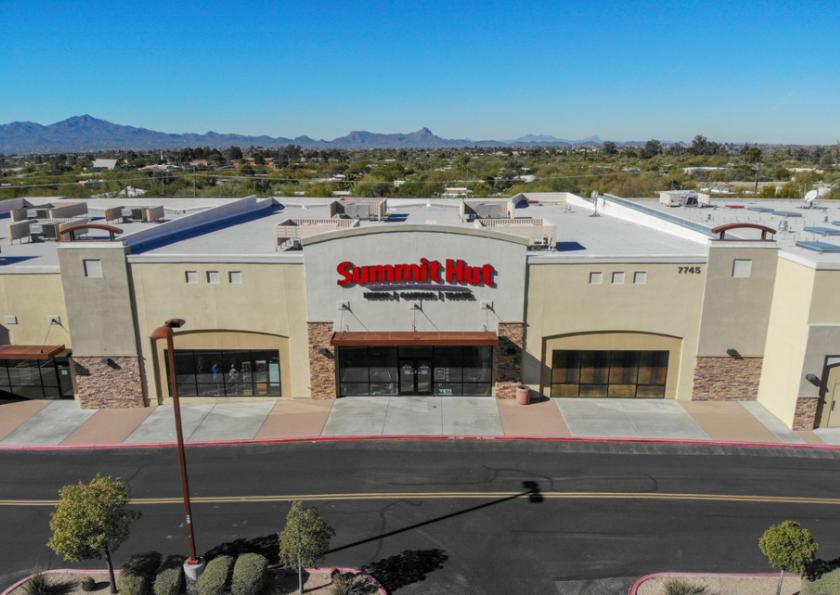
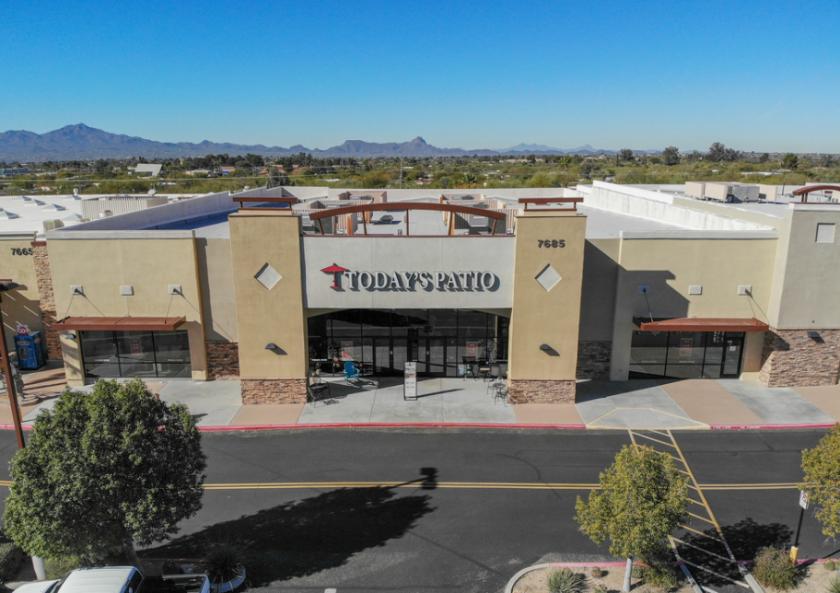
1-Mile | 3-Miles | 5-Miles | ||
---|---|---|---|---|
Total Population | 4,652 | 42,647 | 143,633 | |
Population Median Age | 44 | 45 | 42 | |
Population by Age | 0-9 Yrs | 548 (11%) | 4134 (9%) | 14646 (10%) |
10-19 Yrs | 436 (9%) | 4010 (9%) | 14897 (10%) | |
20-29 Yrs | 685 (14%) | 6200 (14%) | 22839 (15%) | |
30-39 Yrs | 440 (9%) | 4230 (9%) | 16022 (11%) | |
40-49 Yrs | 390 (8%) | 4314 (10%) | 16114 (11%) | |
50-59 Yrs | 496 (10%) | 5231 (12%) | 18222 (12%) | |
60-69 Yrs | 847 (18%) | 6681 (15%) | 19613 (13%) | |
70+ Yrs | 809 (17%) | 7848 (18%) | 21280 (14%) | |
Median HH Income | $61,706 | $61,701 | $58,435 | |
Total Household Income | < 24K | 337 (17%) | 3251 (17%) | 12362 (19%) |
25-49K | 478 (24%) | 4656 (24%) | 14743 (23%) | |
50-74K | 348 (17%) | 3183 (16%) | 11110 (17%) | |
75-99K | 197 (9%) | 2063 (10%) | 7452 (12%) | |
100-199K | 452 (22%) | 4065 (21%) | 11974 (19%) | |
200K+ | 166 (8%) | 1817 (9%) | 4335 (6%) | |
Highest Education Level | No Diploma | 135 | 1423 | 7541 |
Diploma or GED | 655 | 5931 | 20672 | |
Some College | 904 | 7330 | 25317 | |
Assoc. Degree | 239 | 2441 | 8996 | |
Bachelors Degree | 761 | 7695 | 21303 | |
Higher Degree | 631 | 6620 | 18058 | |
Total Housing Units | 2,166 | 21,403 | 69,012 | |
--Owner-Occupied | 1,097 | 10,744 | 37,977 | |
--Renter-Occupied | 881 | 8,291 | 23,999 | |
Owner-Occupied Values | < 100K | 26 | 423 | 5850 |
100-199K | 116 | 1794 | 11237 | |
200-299K | 325 | 3240 | 9393 | |
300-399K | 318 | 2364 | 4929 | |
400-499K | 160 | 1021 | 2095 | |
500K+ | 153 | 1903 | 4473 | |
Total Working Age Population | 3,843 | 36,203 | 120,412 | |
In Work Force | 2,093 | 20,637 | 73,303 | |
Not In Work Force | 1,750 | 15,566 | 47,108 | |
Workforce Employed | 1,928 | 19,386 | 68,117 | |
Workforce Unemployed | 154 | 1,113 | 4,808 | |
Civlian Workforce | 2,082 | 20,499 | 72,925 | |
Military Workforce | 11 | 138 | 379 | |
Total Households | 1,978 | 19,036 | 61,976 | |
Family Households | 1,182 | 10,643 | 36,094 | |
Non-Family Households | 796 | 8,392 | 25,883 | |
Married Couple | 939 | 8,425 | 26,621 | |
Other Family | 243 | 2,218 | 9,473 | |
Married w/Child | 269 | 2,587 | 8,635 | |
Single Male w/Child | 70 | 464 | 1,330 | |
Single Female w/Child | 97 | 744 | 2,971 |
Population Change Last Two Decades - Plus Projection
2000 | % | 2010 | % | 2020 | % | 2030 | |
---|---|---|---|---|---|---|---|
Arizona | 5,130,632 | +25 | 6,392,017 | +14 | 7,286,100 | +14 | 8,284,900 |
Pima County | 843,746 | +16 | 980,263 | +7 | 1,050,900 | +7 | 1,129,200 |
Total Working Age Population:
Total Households:
Total Working Age Population:
Total Households:
Total Working Age Population:
Total Households: