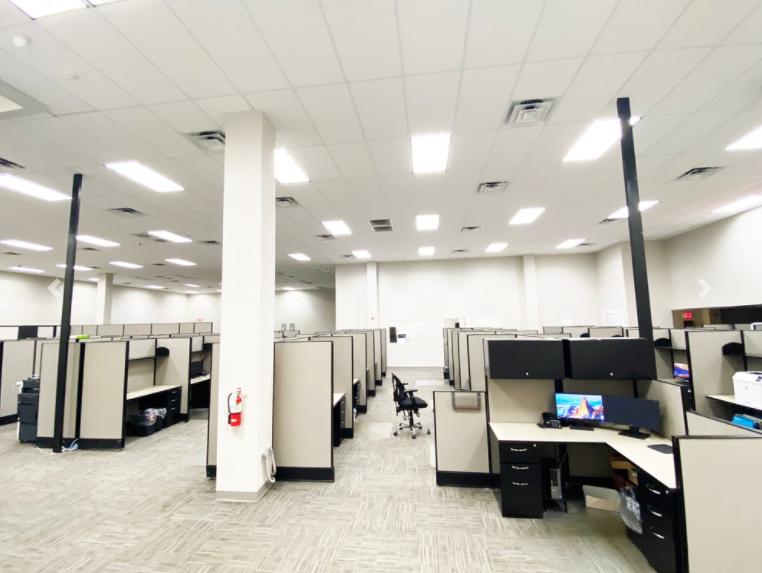
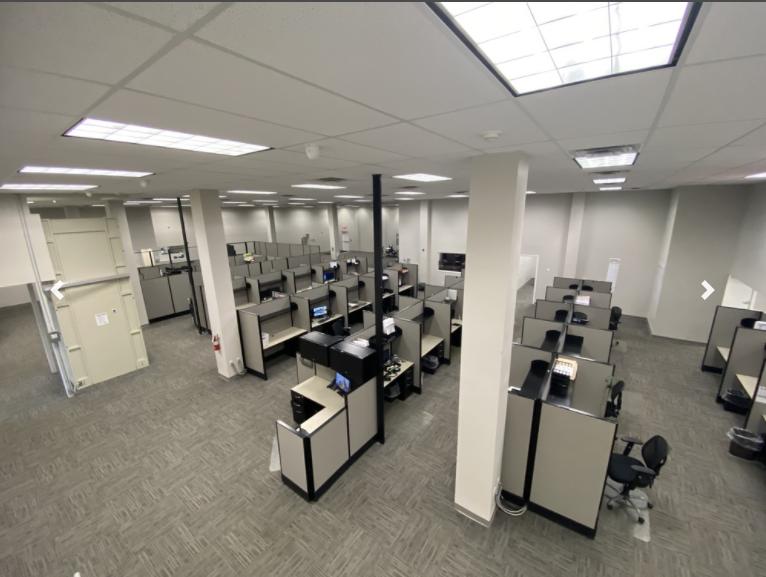
Fully built out, modern call center with second-floor office space.
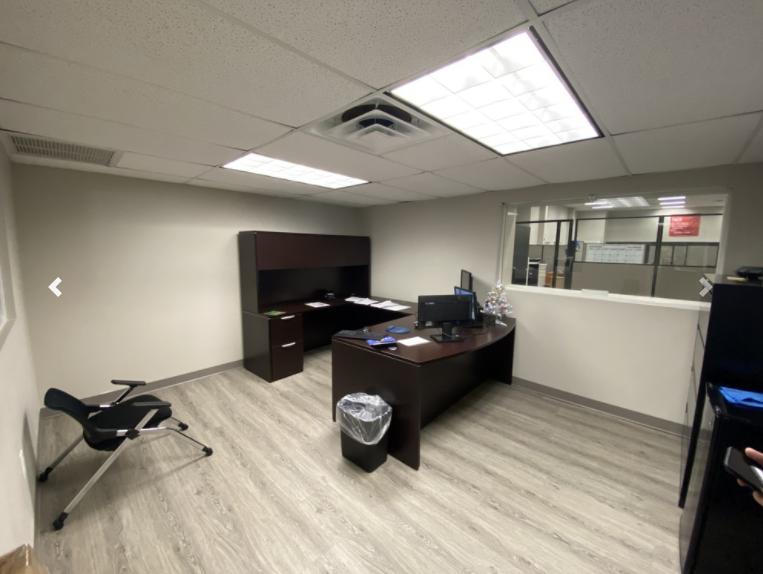
• 10 private offices, 4 conference rooms, 2 large lunch rooms with kitchen.
• 2 independently climate-controlled server rooms
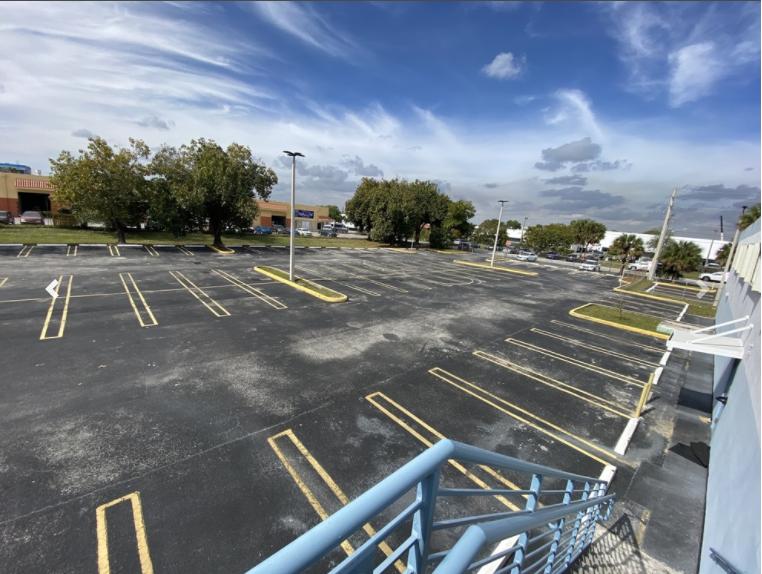
• Ample parking with ratio of 6.65 /1000 SF (159 spaces).
• Furniture may be included.
• Controlled building access with fob and touch ID system.
Location Features
• 1.0 Mi to SR826 (Palmetto Expressway)
• 1.0 Mi to W. Okeechobee Rd.
• Home to Fortune 500 companies and Government headquarters
• Close by the Miami International Airport
Lease Details
• Lease Rate $14.00 NNN
• Total Available SF: 24,017
• Sublease Term: Negotiable
No part of this information may be copied, reproduced, repurposed, or screen-captured for any commercial purpose without prior written authorization from MyEListing.
While we strive to provide the most accurate information, all listing information, and demographic data, is provided by third-parties. As such, MyEListing will not be responsible for the accuracy of the information. It is strongly recommended that you verify all information with the listing agent, and any relevant agencies, prior to making any decisions.
What is the asking price for 7260 Northwest 68th Street in Miami?
The asking price for 7260 Northwest 68th Street is $11.50 a SF per Year
What is the building size of this commercial Office property?
The size of this lease property at '.7260 Northwest 68th Street.' is 24017 square feet
What kind of Office is the propery at 7260 Northwest 68th Street?
The property at 7260 Northwest 68th Street Miami, FL 33166 is listed as a Professional Office property
What is the population within 1 mile of 7260 Northwest 68th Street in Miami?
The population within 1 mile of 7260 Northwest 68th Street Miami, FL 33166 is 10,711 people.
Who do I contact for questions about 7260 Northwest 68th Street?
You should contact the listing agent,
Jake Guso, for any details regarding this commercial listing.