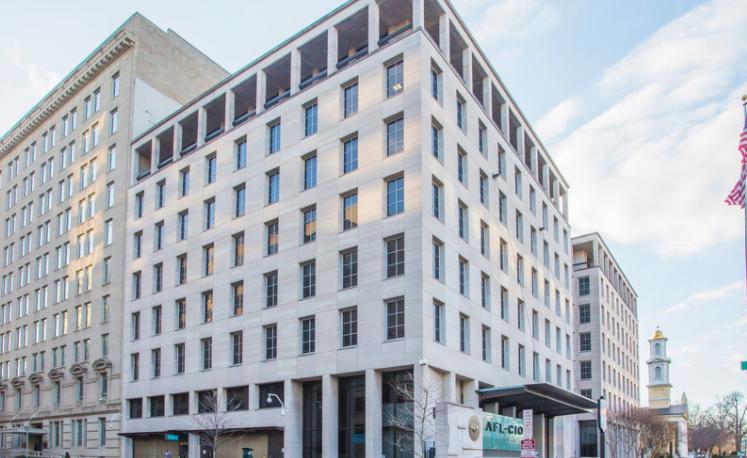
1-Mile | 3-Miles | 5-Miles | ||
---|---|---|---|---|
Total Population | 54,113 | 379,445 | 821,082 | |
Population Median Age | 36 | 36 | 37 | |
Population by Age | 0-9 Yrs | 2143 (3%) | 29352 (7%) | 88310 (10%) |
10-19 Yrs | 4653 (8%) | 25518 (6%) | 69832 (8%) | |
20-29 Yrs | 17223 (31%) | 100210 (26%) | 171904 (20%) | |
30-39 Yrs | 13200 (24%) | 93420 (24%) | 173128 (21%) | |
40-49 Yrs | 5003 (9%) | 42872 (11%) | 100318 (12%) | |
50-59 Yrs | 4880 (9%) | 34869 (9%) | 86560 (10%) | |
60-69 Yrs | 3723 (6%) | 27878 (7%) | 68684 (8%) | |
70+ Yrs | 3287 (6%) | 25326 (6%) | 62345 (7%) | |
Median HH Income | $103,532 | $108,851 | $99,161 | |
Total Household Income | < 24K | 4280 (15%) | 23592 (13%) | 53650 (15%) |
25-49K | 3011 (10%) | 16938 (9%) | 41418 (11%) | |
50-74K | 3111 (11%) | 20225 (11%) | 42961 (12%) | |
75-99K | 3254 (11%) | 20268 (11%) | 39516 (11%) | |
100-199K | 9132 (32%) | 57320 (32%) | 104992 (29%) | |
200K+ | 5464 (19%) | 37866 (21%) | 69908 (19%) | |
Highest Education Level | No Diploma | 1730 | 18722 | 48085 |
Diploma or GED | 2557 | 24544 | 77752 | |
Some College | 2308 | 20944 | 63636 | |
Assoc. Degree | 590 | 6359 | 17374 | |
Bachelors Degree | 12074 | 91267 | 170256 | |
Higher Degree | 20166 | 125841 | 220623 | |
Total Housing Units | 31,826 | 195,484 | 387,216 | |
--Owner-Occupied | 8,602 | 63,818 | 141,965 | |
--Renter-Occupied | 19,650 | 112,390 | 210,480 | |
Owner-Occupied Values | < 100K | 154 | 887 | 2210 |
100-199K | 103 | 929 | 3007 | |
200-299K | 650 | 3685 | 10900 | |
300-399K | 1209 | 7173 | 17730 | |
400-499K | 1233 | 7232 | 17538 | |
500K+ | 5252 | 43913 | 90580 | |
Total Working Age Population | 51,381 | 339,957 | 696,781 | |
In Work Force | 38,015 | 261,645 | 512,286 | |
Not In Work Force | 13,366 | 78,312 | 184,496 | |
Workforce Employed | 36,339 | 248,189 | 478,923 | |
Workforce Unemployed | 1,402 | 10,585 | 26,131 | |
Civlian Workforce | 37,740 | 258,774 | 505,053 | |
Military Workforce | 274 | 2,870 | 7,232 | |
Total Households | 28,252 | 176,208 | 352,445 | |
Family Households | 6,126 | 58,671 | 148,350 | |
Non-Family Households | 22,126 | 117,538 | 204,095 | |
Married Couple | 5,226 | 43,903 | 101,987 | |
Other Family | 900 | 14,768 | 46,363 | |
Married w/Child | 1,006 | 13,756 | 39,674 | |
Single Male w/Child | 92 | 1,251 | 4,364 | |
Single Female w/Child | 254 | 5,248 | 16,836 |
Population Change Last Two Decades - Plus Projection
2000 | % | 2010 | % | 2020 | % | 2030 | |
---|---|---|---|---|---|---|---|
District of Columbia | 572,059 | +5 | 601,723 | +21 | 729,501 | +15 | 842,154 |
Maryland | 5,296,486 | +9 | 5,773,552 | +6 | 6,141,900 | +6 | 6,518,750 |
Montgomery County | 873,341 | +11 | 971,777 | +8 | 1,052,050 | +7 | 1,128,800 |
Prince Georges County | 801,515 | +8 | 863,420 | +6 | 916,150 | +4 | 952,950 |
Virginia | 7,078,515 | +13 | 8,001,024 | +8 | 8,655,021 | +8 | 9,331,666 |
Arlington County | 189,453 | +10 | 207,627 | +20 | 249,298 | +10 | 274,339 |
Fairfax County | 969,749 | +12 | 1,081,726 | +7 | 1,162,504 | +7 | 1,244,025 |
Alexandria city | 128,283 | +9 | 139,966 | +19 | 166,261 | +10 | 182,067 |
Total Working Age Population:
Total Households:
Total Working Age Population:
Total Households:
Total Working Age Population:
Total Households: