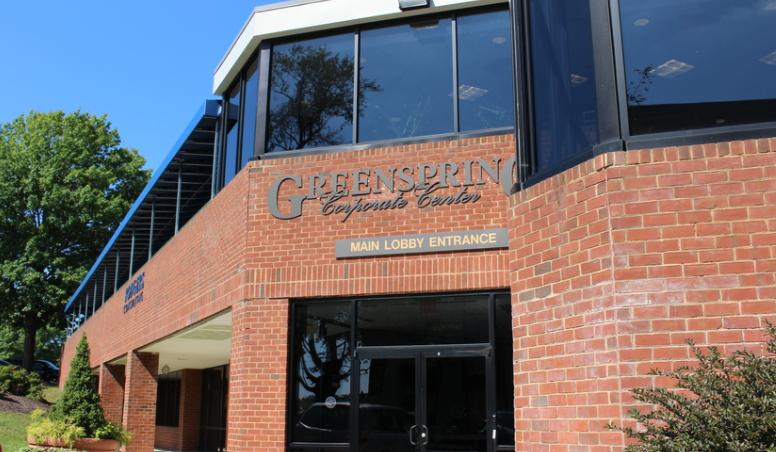
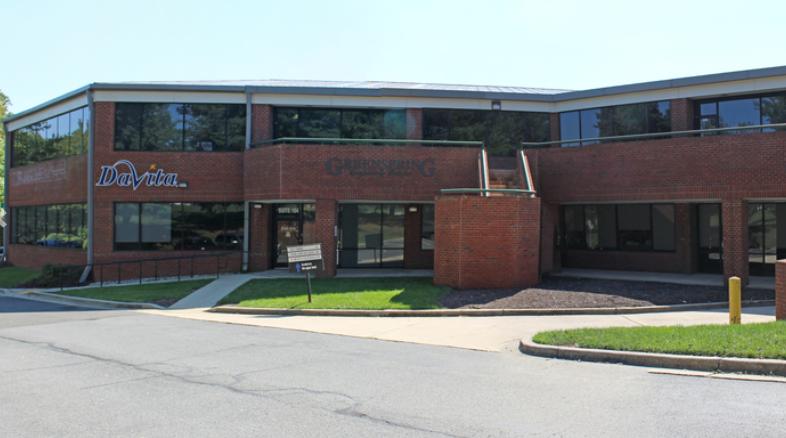
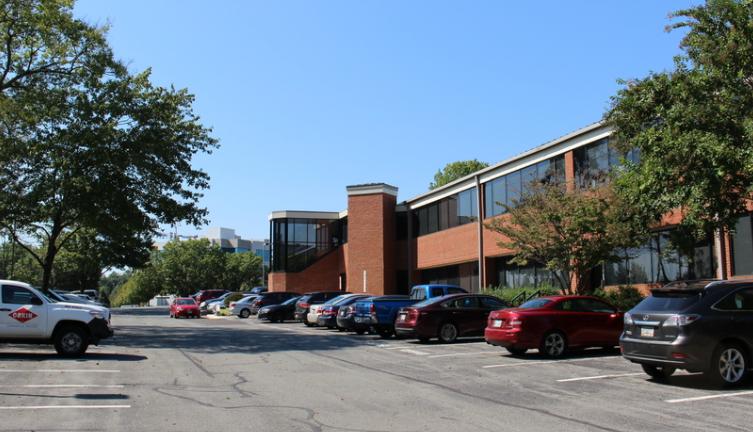
1-Mile | 3-Miles | 5-Miles | ||
---|---|---|---|---|
Total Population | 10,214 | 87,020 | 239,970 | |
Population Median Age | 39 | 39 | 38 | |
Population by Age | 0-9 Yrs | 1124 (11%) | 10588 (12%) | 31115 (12%) |
10-19 Yrs | 1020 (9%) | 10172 (11%) | 28719 (11%) | |
20-29 Yrs | 1545 (15%) | 11204 (12%) | 31443 (13%) | |
30-39 Yrs | 1697 (16%) | 11719 (13%) | 33571 (13%) | |
40-49 Yrs | 1360 (13%) | 11570 (13%) | 30589 (12%) | |
50-59 Yrs | 1446 (14%) | 12573 (14%) | 34824 (14%) | |
60-69 Yrs | 1186 (11%) | 10872 (12%) | 29114 (12%) | |
70+ Yrs | 835 (8%) | 8321 (9%) | 20595 (8%) | |
Median HH Income | $91,581 | $90,510 | $82,345 | |
Total Household Income | < 24K | 388 (8%) | 2823 (9%) | 9944 (11%) |
25-49K | 576 (12%) | 4165 (13%) | 12987 (15%) | |
50-74K | 719 (15%) | 5290 (16%) | 15362 (18%) | |
75-99K | 869 (19%) | 5488 (17%) | 12532 (14%) | |
100-199K | 1670 (36%) | 10618 (33%) | 25361 (30%) | |
200K+ | 296 (6%) | 2982 (9%) | 7765 (9%) | |
Highest Education Level | No Diploma | 314 | 4865 | 18985 |
Diploma or GED | 1306 | 16090 | 47248 | |
Some College | 1622 | 13849 | 37387 | |
Assoc. Degree | 488 | 3671 | 10037 | |
Bachelors Degree | 2075 | 12605 | 29284 | |
Higher Degree | 1635 | 10020 | 22833 | |
Total Housing Units | 4,943 | 33,713 | 89,695 | |
--Owner-Occupied | 2,547 | 21,544 | 56,631 | |
--Renter-Occupied | 1,971 | 9,822 | 27,319 | |
Owner-Occupied Values | < 100K | 119 | 998 | 2524 |
100-199K | 379 | 3471 | 9321 | |
200-299K | 872 | 7277 | 19171 | |
300-399K | 780 | 5948 | 14444 | |
400-499K | 268 | 2347 | 6399 | |
500K+ | 129 | 1504 | 4773 | |
Total Working Age Population | 8,467 | 70,338 | 191,234 | |
In Work Force | 6,366 | 50,115 | 134,764 | |
Not In Work Force | 2,101 | 20,223 | 56,469 | |
Workforce Employed | 5,944 | 46,759 | 124,512 | |
Workforce Unemployed | 412 | 3,180 | 9,979 | |
Civlian Workforce | 6,356 | 49,939 | 134,491 | |
Military Workforce | 10 | 176 | 273 | |
Total Households | 4,518 | 31,366 | 83,950 | |
Family Households | 2,120 | 20,135 | 55,406 | |
Non-Family Households | 2,398 | 11,231 | 28,544 | |
Married Couple | 1,148 | 11,452 | 30,921 | |
Other Family | 972 | 8,682 | 24,484 | |
Married w/Child | 402 | 4,137 | 11,646 | |
Single Male w/Child | 104 | 587 | 1,903 | |
Single Female w/Child | 415 | 2,963 | 8,127 |
Population Change Last Two Decades - Plus Projection
2000 | % | 2010 | % | 2020 | % | 2030 | |
---|---|---|---|---|---|---|---|
District of Columbia | 572,059 | +5 | 601,723 | +21 | 729,501 | +15 | 842,154 |
Maryland | 5,296,486 | +9 | 5,773,552 | +6 | 6,141,900 | +6 | 6,518,750 |
Anne Arundel County | 489,656 | +10 | 537,656 | +7 | 573,250 | +4 | 596,700 |
Montgomery County | 873,341 | +11 | 971,777 | +8 | 1,052,050 | +7 | 1,128,800 |
Prince Georges County | 801,515 | +8 | 863,420 | +6 | 916,150 | +4 | 952,950 |
Total Working Age Population:
Total Households:
Total Working Age Population:
Total Households:
Total Working Age Population:
Total Households: