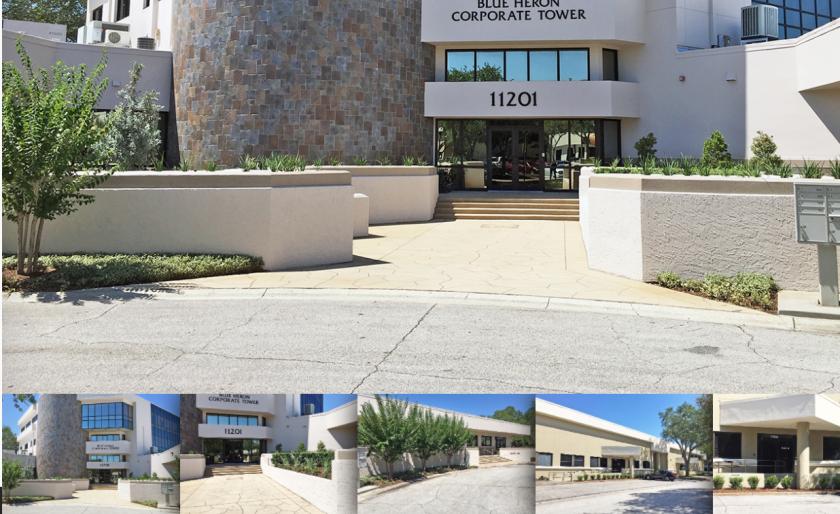
Office space for lease in St Petersburg. The Blue Heron Corporate Center I & II are very attractive professional office buildings located within the serene, tree canopied campus of Blue Heron Corporate Center. Centrally located on Roosevelt Blvd east of I-275, the property provides 10-15 minute travel time to major airports, downtown St Petersburg, & Westshore. Both buildings recently underwent exterior renovations with new landscaping, and provides that upscale professional image desired.
Available Suites
(Click suite for floor plan):
Blue Heron Corporate Center I - 11201 Corporate Circle
Suite 200 - 7,802 sf - $15 psf NNN
Suite 200 - 7,850 sf - $15 psf NNN
Blue Heron Corporate Center II - 10701 Danka Circle N
Suite A - 8,600 sf (contiguous to 19,445 sf) - $10 psf NNN
Suite B - 5,006 sf (contiguous to 19,445 sf) - $10 psf NNN
Suite C - 5,839 sf (contiguous to 19,445 sf) - $10 psf NNN
No part of this information may be copied, reproduced, repurposed, or screen-captured for any commercial purpose without prior written authorization from MyEListing.
While we strive to provide the most accurate information, all listing information, and demographic data, is provided by third-parties. As such, MyEListing will not be responsible for the accuracy of the information. It is strongly recommended that you verify all information with the listing agent, and any relevant agencies, prior to making any decisions.
What is the asking price for 11201 Corporate Circle in St Petersburg?
The asking price for 11201 Corporate Circle is $10.00 - $15.00 a SF per Year
What is the building size of this commercial Office property?
The size of this multi-unit property varies between 5006 - 19445 square feet
What kind of Office is the propery at 11201 Corporate Circle?
The property at 11201 Corporate Circle St Petersburg, FL 33716 is listed as a Professional Office property
What is the population within 1 mile of 11201 Corporate Circle in St Petersburg?
The population within 1 mile of 11201 Corporate Circle St Petersburg, FL 33716 is 7,624 people.
Who do I contact for questions about 11201 Corporate Circle?
You should contact the listing agent,
Judy Healey, for any details regarding this commercial listing.