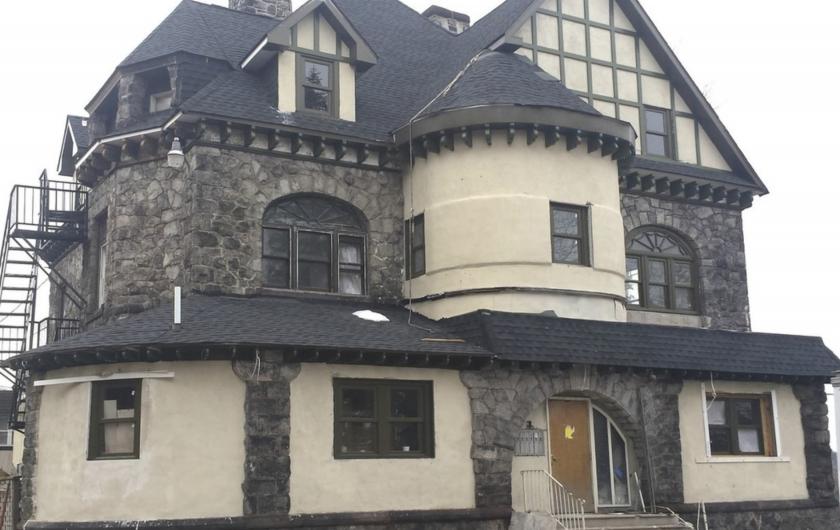
1-Mile | 3-Miles | 5-Miles | ||
---|---|---|---|---|
Total Population | 35,915 | 123,131 | 194,279 | |
Population Median Age | 33 | 35 | 38 | |
Population by Age | 0-9 Yrs | 6416 (17%) | 19288 (15%) | 27266 (14%) |
10-19 Yrs | 5423 (15%) | 18482 (15%) | 27320 (14%) | |
20-29 Yrs | 6286 (17%) | 19534 (15%) | 27604 (14%) | |
30-39 Yrs | 4740 (13%) | 15721 (12%) | 24300 (12%) | |
40-49 Yrs | 3869 (10%) | 14118 (11%) | 22651 (11%) | |
50-59 Yrs | 3816 (10%) | 14426 (11%) | 24589 (12%) | |
60-69 Yrs | 2992 (8%) | 11045 (8%) | 19592 (10%) | |
70+ Yrs | 2373 (6%) | 10518 (8%) | 20957 (10%) | |
Median HH Income | $28,091 | $40,122 | $52,372 | |
Total Household Income | < 24K | 5661 (45%) | 14171 (33%) | 17005 (24%) |
25-49K | 3356 (27%) | 11089 (25%) | 16992 (23%) | |
50-74K | 1788 (14%) | 7165 (16%) | 12668 (17%) | |
75-99K | 893 (7%) | 4486 (10%) | 8866 (12%) | |
100-199K | 677 (5%) | 5116 (11%) | 12812 (18%) | |
200K+ | 19 (0%) | 728 (1%) | 2458 (3%) | |
Highest Education Level | No Diploma | 7345 | 18932 | 22838 |
Diploma or GED | 7380 | 26723 | 43202 | |
Some College | 3277 | 12354 | 21192 | |
Assoc. Degree | 1160 | 5458 | 9886 | |
Bachelors Degree | 1320 | 8173 | 18749 | |
Higher Degree | 507 | 4065 | 10311 | |
Total Housing Units | 14,647 | 48,088 | 77,786 | |
--Owner-Occupied | 4,092 | 20,706 | 42,780 | |
--Renter-Occupied | 8,302 | 22,049 | 28,021 | |
Owner-Occupied Values | < 100K | 3461 | 9829 | 11868 |
100-199K | 440 | 7960 | 19245 | |
200-299K | 81 | 1863 | 7459 | |
300-399K | 42 | 580 | 2519 | |
400-499K | 14 | 121 | 698 | |
500K+ | 54 | 355 | 991 | |
Total Working Age Population | 26,246 | 93,226 | 151,099 | |
In Work Force | 15,701 | 58,653 | 97,056 | |
Not In Work Force | 10,545 | 34,573 | 54,043 | |
Workforce Employed | 13,148 | 52,573 | 89,246 | |
Workforce Unemployed | 2,553 | 6,065 | 7,720 | |
Civlian Workforce | 15,701 | 58,638 | 96,965 | |
Military Workforce | 0 | 15 | 91 | |
Total Households | 12,394 | 42,755 | 70,801 | |
Family Households | 7,290 | 27,311 | 46,772 | |
Non-Family Households | 5,104 | 15,444 | 24,029 | |
Married Couple | 3,003 | 14,407 | 29,483 | |
Other Family | 4,287 | 12,905 | 17,289 | |
Married w/Child | 1,359 | 6,458 | 11,890 | |
Single Male w/Child | 381 | 1,313 | 1,893 | |
Single Female w/Child | 2,310 | 6,307 | 8,049 |
Population Change Last Two Decades - Plus Projection
2000 | % | 2010 | % | 2020 | % | 2030 | |
---|---|---|---|---|---|---|---|
Pennsylvania | 12,281,054 | +3 | 12,702,379 | +4 | 13,230,170 | +4 | 13,759,594 |
Berks County | 373,638 | +10 | 411,442 | +7 | 440,143 | +7 | 471,457 |
Lancaster County | 470,658 | +10 | 519,445 | +8 | 559,247 | +8 | 602,153 |
Total Working Age Population:
Total Households:
Total Working Age Population:
Total Households:
Total Working Age Population:
Total Households: