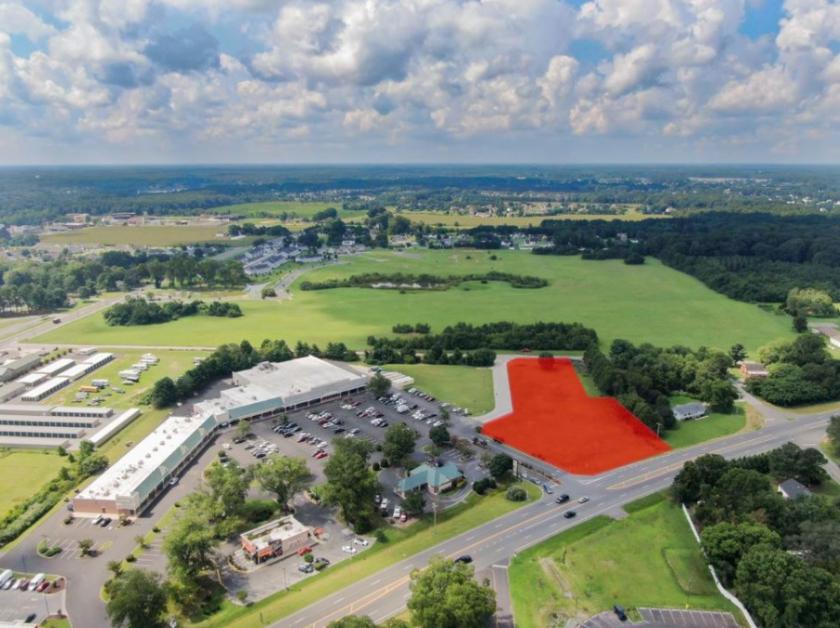
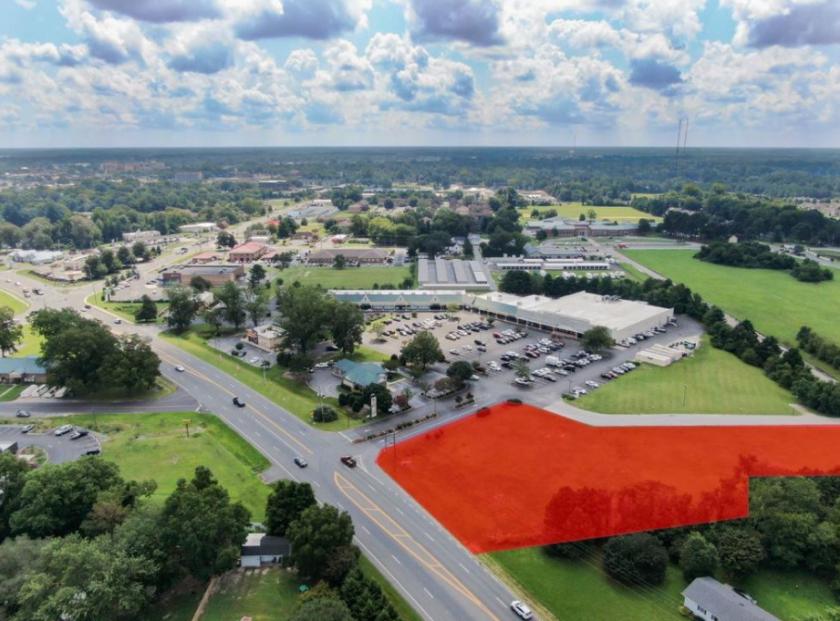
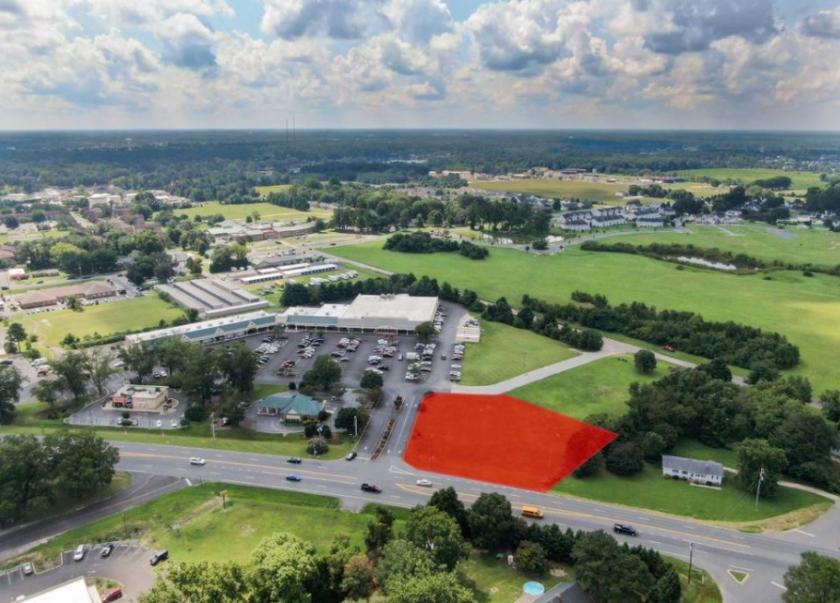
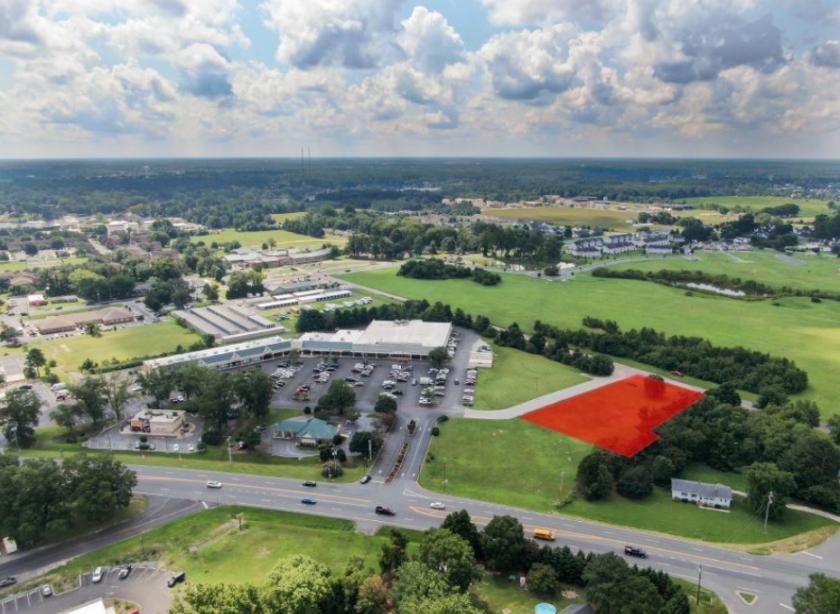
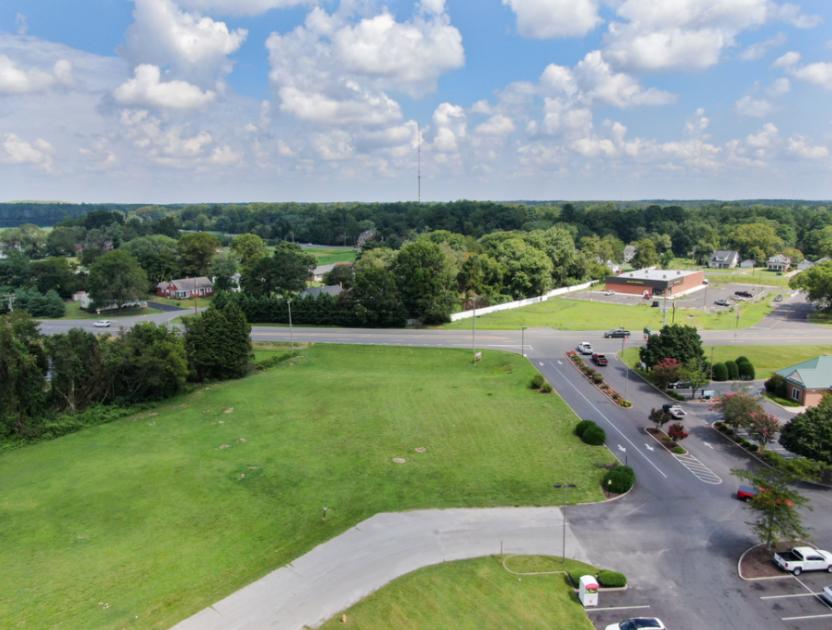
1-Mile | 3-Miles | 5-Miles | ||
---|---|---|---|---|
Total Population | 1,573 | 9,807 | 42,405 | |
Population Median Age | 36 | 38 | 37 | |
Population by Age | 0-9 Yrs | 367 (23%) | 1446 (14%) | 5061 (11%) |
10-19 Yrs | 141 (8%) | 1442 (14%) | 7773 (18%) | |
20-29 Yrs | 135 (8%) | 1129 (11%) | 6562 (15%) | |
30-39 Yrs | 235 (14%) | 926 (9%) | 4561 (10%) | |
40-49 Yrs | 152 (9%) | 1200 (12%) | 4412 (10%) | |
50-59 Yrs | 197 (12%) | 1465 (14%) | 5452 (12%) | |
60-69 Yrs | 245 (15%) | 1259 (12%) | 4690 (11%) | |
70+ Yrs | 100 (6%) | 941 (9%) | 3894 (9%) | |
Median HH Income | $113,171 | $100,773 | $55,125 | |
Total Household Income | < 24K | 42 (8%) | 305 (9%) | 3442 (22%) |
25-49K | 50 (10%) | 631 (18%) | 3531 (23%) | |
50-74K | 64 (13%) | 437 (13%) | 2742 (18%) | |
75-99K | 49 (10%) | 280 (8%) | 1480 (9%) | |
100-199K | 229 (47%) | 1356 (40%) | 3264 (21%) | |
200K+ | 51 (10%) | 331 (9%) | 663 (4%) | |
Highest Education Level | No Diploma | 24 | 337 | 3053 |
Diploma or GED | 163 | 1372 | 7543 | |
Some College | 210 | 1240 | 4928 | |
Assoc. Degree | 106 | 435 | 1643 | |
Bachelors Degree | 299 | 1693 | 4658 | |
Higher Degree | 188 | 1263 | 3424 | |
Total Housing Units | 495 | 3,514 | 17,195 | |
--Owner-Occupied | 458 | 2,879 | 8,133 | |
--Renter-Occupied | 27 | 460 | 6,991 | |
Owner-Occupied Values | < 100K | 23 | 184 | 1215 |
100-199K | 79 | 721 | 3137 | |
200-299K | 242 | 1112 | 2297 | |
300-399K | 101 | 648 | 900 | |
400-499K | 8 | 65 | 240 | |
500K+ | 5 | 148 | 344 | |
Total Working Age Population | 1,113 | 7,432 | 33,638 | |
In Work Force | 743 | 5,182 | 21,190 | |
Not In Work Force | 370 | 2,250 | 12,448 | |
Workforce Employed | 681 | 4,952 | 19,277 | |
Workforce Unemployed | 62 | 230 | 1,900 | |
Civlian Workforce | 743 | 5,182 | 21,178 | |
Military Workforce | 0 | 0 | 12 | |
Total Households | 485 | 3,339 | 15,123 | |
Family Households | 406 | 2,622 | 9,278 | |
Non-Family Households | 79 | 716 | 5,845 | |
Married Couple | 346 | 2,131 | 6,263 | |
Other Family | 60 | 491 | 3,015 | |
Married w/Child | 154 | 1,024 | 2,673 | |
Single Male w/Child | 30 | 118 | 464 | |
Single Female w/Child | 8 | 85 | 1,299 |
Population Change Last Two Decades - Plus Projection
2000 | % | 2010 | % | 2020 | % | 2030 | |
---|---|---|---|---|---|---|---|
Maryland | 5,296,486 | +9 | 5,773,552 | +6 | 6,141,900 | +6 | 6,518,750 |
Dorchester County | 30,674 | +6 | 32,618 | +5 | 34,300 | +9 | 37,350 |
Somerset County | 24,747 | +7 | 26,470 | +1 | 26,750 | +6 | 28,450 |
Wicomico County | 84,644 | +17 | 98,733 | +8 | 106,200 | +11 | 118,200 |
Worcester County | 46,543 | +11 | 51,454 | +3 | 53,100 | +9 | 57,950 |
Total Working Age Population:
Total Households:
Total Working Age Population:
Total Households:
Total Working Age Population:
Total Households: