Office Space
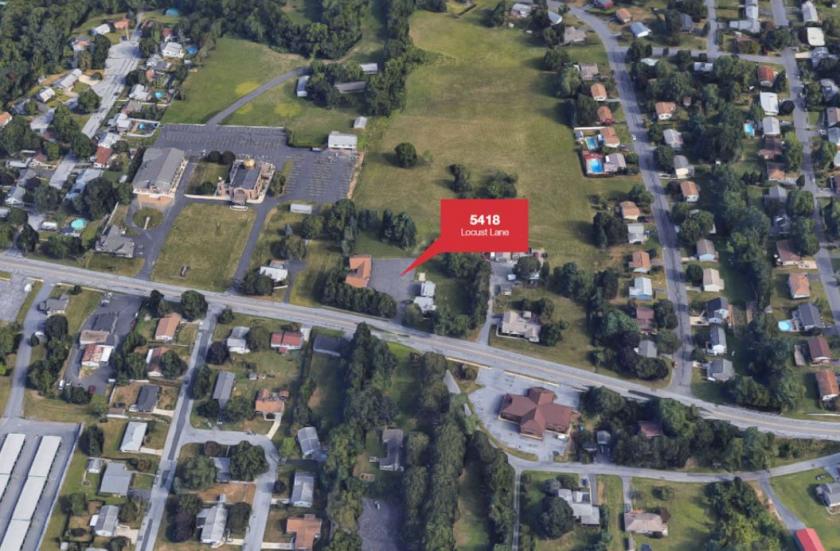
5418 Locust Lane Harrisburg, PA 17109
5418 Locust Lane Harrisburg, PA 17109
Details & Description
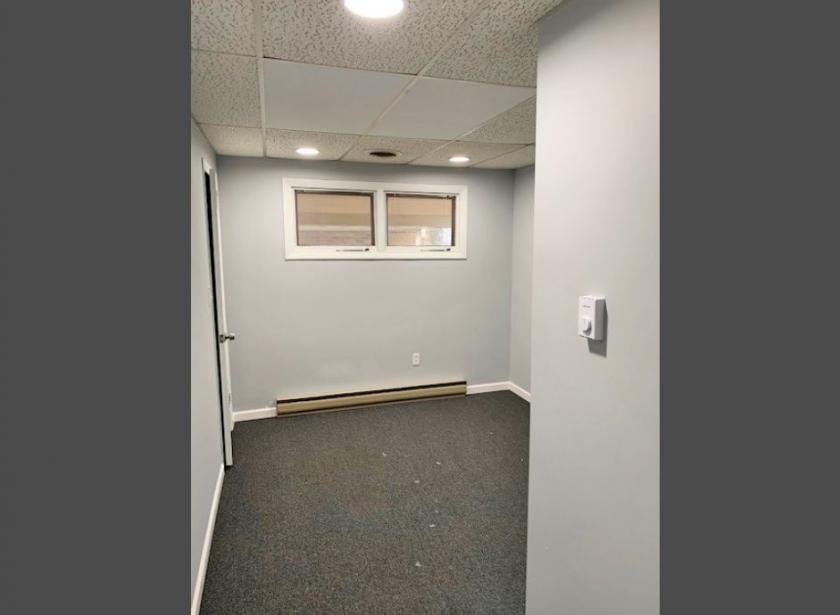
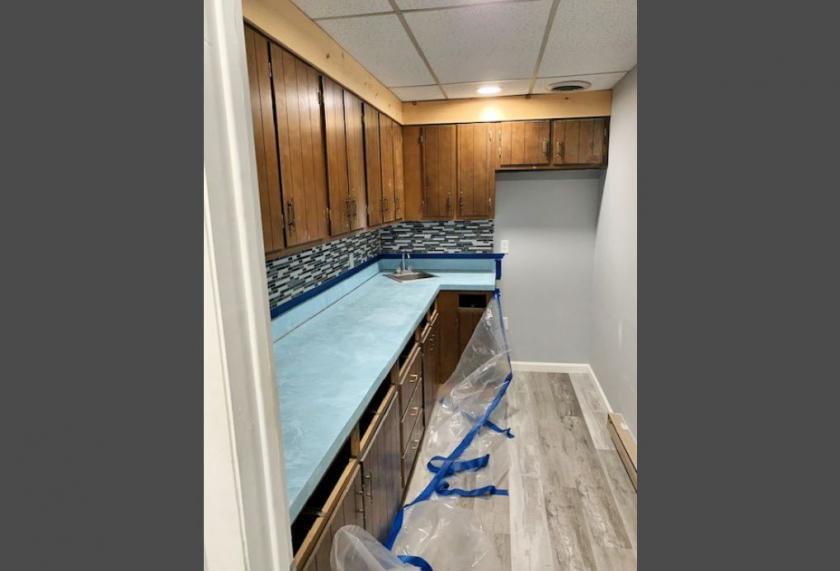
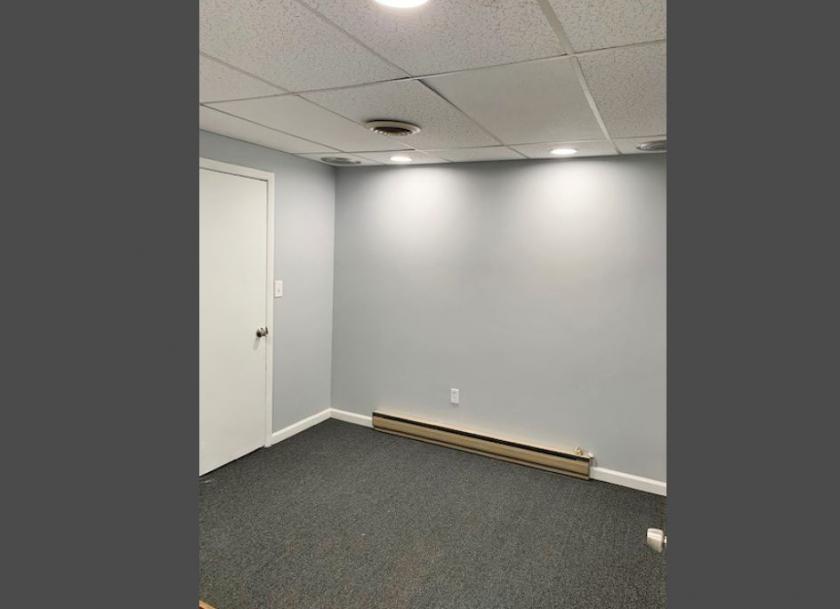
Additional Photos
Listing Agents

Peter Higgins
O: 717-761-5070
M: 717-319-7666
phiggins@naicir.com
O: 717-761-5070
M: 717-319-7666
phiggins@naicir.com

David Alderman
O: 717-761-5070
M: 717-460-8152
davidalderman@naicir.com
O: 717-761-5070
M: 717-460-8152
davidalderman@naicir.com
While we strive to provide the most accurate information, all listing information, and demographic data, is provided by third-parties. As such, MyEListing will not be responsible for the accuracy of the information. It is strongly recommended that you verify all information with the listing agent, and any relevant agencies, prior to making any decisions.


