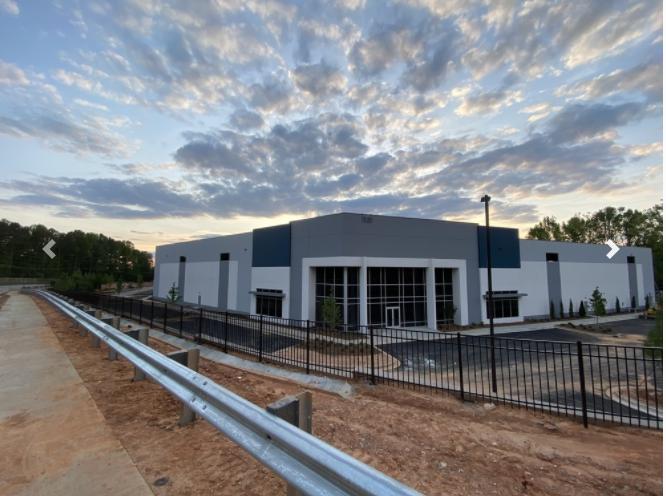
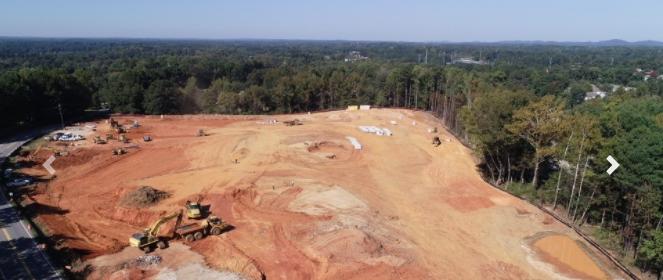
1-Mile | 3-Miles | 5-Miles | ||
---|---|---|---|---|
Total Population | 10,092 | 73,214 | 147,919 | |
Population Median Age | 36 | 35 | 36 | |
Population by Age | 0-9 Yrs | 1337 (13%) | 8914 (12%) | 17632 (11%) |
10-19 Yrs | 1808 (17%) | 11734 (16%) | 23422 (15%) | |
20-29 Yrs | 947 (9%) | 11133 (15%) | 22868 (15%) | |
30-39 Yrs | 1356 (13%) | 10013 (13%) | 19589 (13%) | |
40-49 Yrs | 1735 (17%) | 11563 (15%) | 21886 (14%) | |
50-59 Yrs | 1425 (14%) | 9103 (12%) | 19386 (13%) | |
60-69 Yrs | 915 (9%) | 6462 (8%) | 13994 (9%) | |
70+ Yrs | 568 (5%) | 4292 (5%) | 9142 (6%) | |
Median HH Income | $89,311 | $77,840 | $75,754 | |
Total Household Income | < 24K | 278 (7%) | 3051 (11%) | 6503 (12%) |
25-49K | 523 (15%) | 4956 (19%) | 9922 (19%) | |
50-74K | 565 (16%) | 4294 (16%) | 9311 (17%) | |
75-99K | 659 (18%) | 4476 (17%) | 8273 (15%) | |
100-199K | 1169 (33%) | 7549 (29%) | 14887 (28%) | |
200K+ | 293 (8%) | 1294 (5%) | 3076 (5%) | |
Highest Education Level | No Diploma | 377 | 3746 | 7549 |
Diploma or GED | 1086 | 9446 | 20170 | |
Some College | 1352 | 10622 | 21654 | |
Assoc. Degree | 585 | 4077 | 7487 | |
Bachelors Degree | 1875 | 12512 | 25079 | |
Higher Degree | 1121 | 5779 | 12073 | |
Total Housing Units | 3,633 | 27,383 | 55,114 | |
--Owner-Occupied | 2,753 | 18,250 | 36,220 | |
--Renter-Occupied | 733 | 7,370 | 15,751 | |
Owner-Occupied Values | < 100K | 49 | 1187 | 2343 |
100-199K | 1060 | 8016 | 14991 | |
200-299K | 1192 | 6583 | 12029 | |
300-399K | 345 | 1956 | 4155 | |
400-499K | 85 | 245 | 988 | |
500K+ | 21 | 263 | 1715 | |
Total Working Age Population | 7,738 | 57,873 | 117,774 | |
In Work Force | 5,478 | 41,482 | 82,258 | |
Not In Work Force | 2,260 | 16,391 | 35,516 | |
Workforce Employed | 5,235 | 39,506 | 78,552 | |
Workforce Unemployed | 220 | 1,863 | 3,522 | |
Civlian Workforce | 5,455 | 41,369 | 82,074 | |
Military Workforce | 24 | 114 | 184 | |
Total Households | 3,486 | 25,620 | 51,972 | |
Family Households | 2,621 | 18,118 | 36,208 | |
Non-Family Households | 865 | 7,502 | 15,764 | |
Married Couple | 2,028 | 13,836 | 27,989 | |
Other Family | 593 | 4,282 | 8,218 | |
Married w/Child | 1,196 | 6,342 | 12,312 | |
Single Male w/Child | 26 | 371 | 750 | |
Single Female w/Child | 260 | 1,967 | 3,424 |
Population Change Last Two Decades - Plus Projection
2000 | % | 2010 | % | 2020 | % | 2030 | |
---|---|---|---|---|---|---|---|
Georgia | 8,186,453 | +18 | 9,687,653 | +12 | 10,833,472 | +13 | 12,292,423 |
Bartow County | 76,019 | +32 | 100,157 | +11 | 110,771 | +18 | 130,468 |
Cherokee County | 141,903 | +51 | 214,346 | +24 | 266,617 | +20 | 320,849 |
Cobb County | 607,751 | +13 | 688,078 | +15 | 790,588 | +19 | 938,747 |
Fulton County | 816,006 | +13 | 920,581 | +19 | 1,099,181 | +18 | 1,300,861 |
Paulding County | 81,678 | +74 | 142,324 | +21 | 172,542 | +21 | 208,525 |
Total Working Age Population:
Total Households:
Total Working Age Population:
Total Households:
Total Working Age Population:
Total Households: