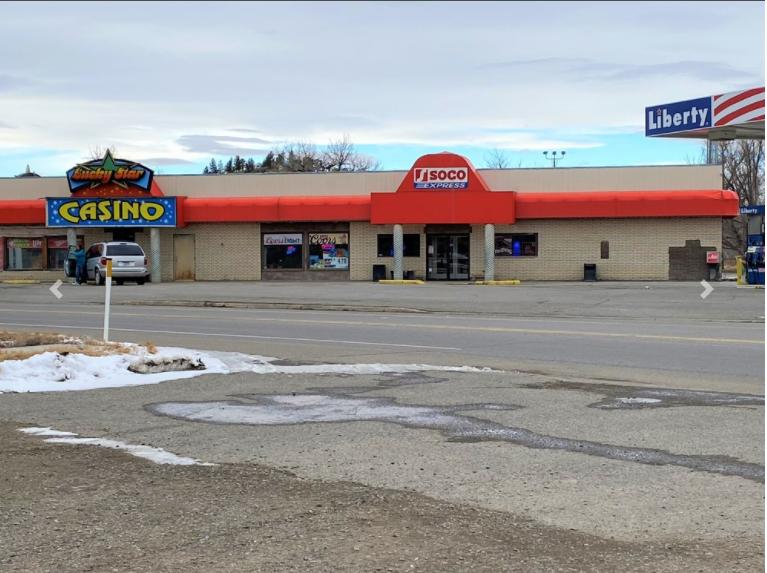
Retail Space
701 1st Avenue West Roundup, MT 59072
701 1st Avenue West Roundup, MT 59072
Details & Description
Property Highlights
- •
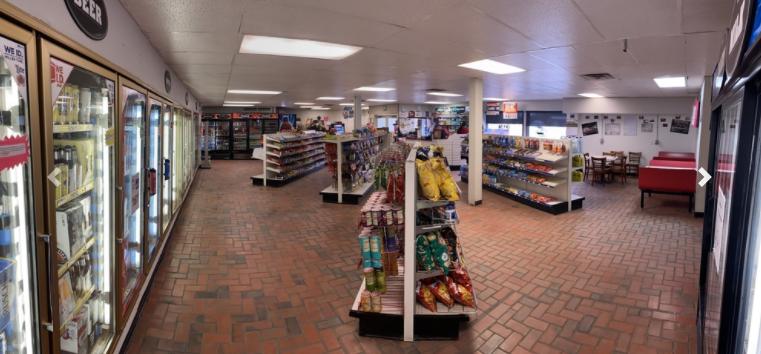
- • Fueling Station
- • Full Liquor Gaming licenses available
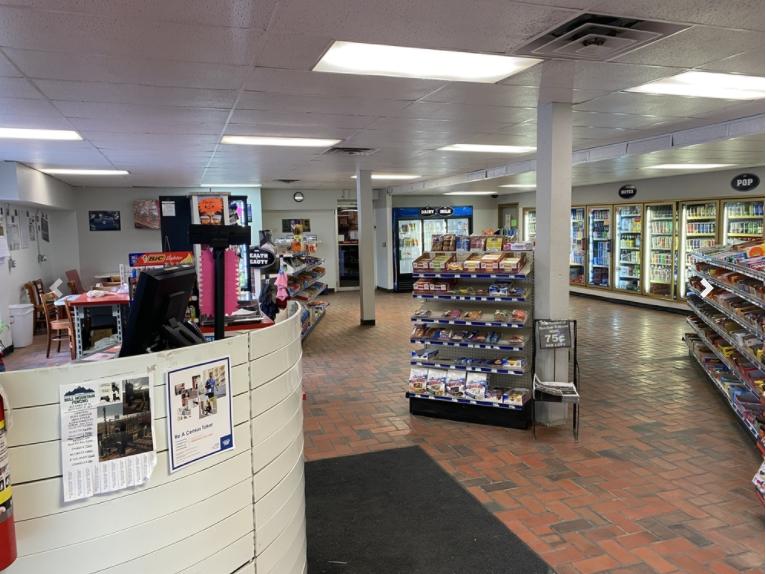
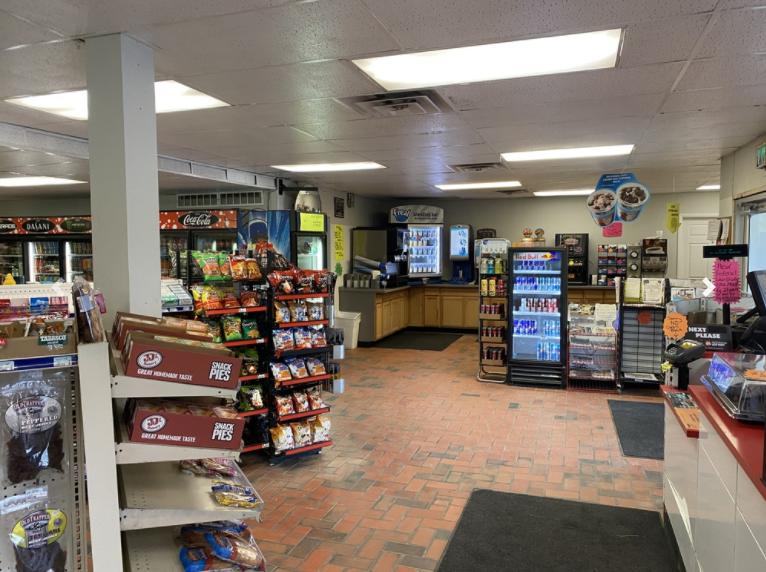
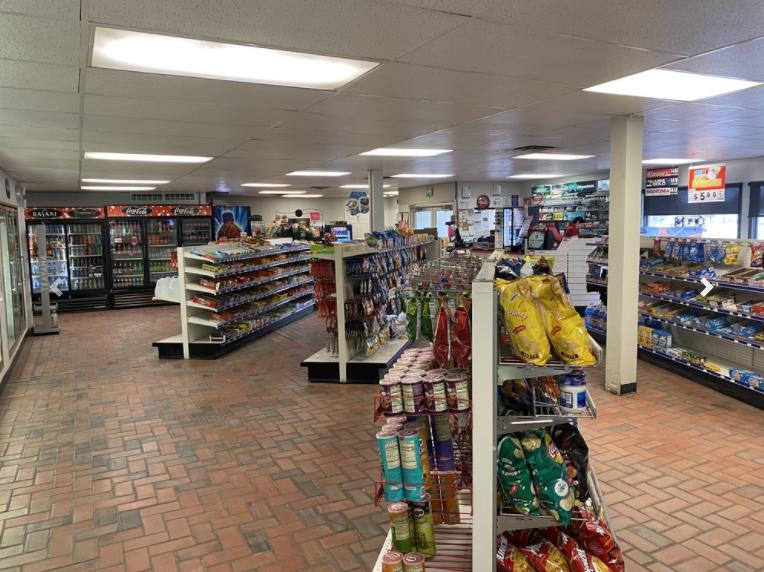
Additional Photos
Listing Agents

Haley Vannatta
O: 406-294-6317
M: 406-672-1443
hvannatta@naibusinessproperties.com
O: 406-294-6317
M: 406-672-1443
hvannatta@naibusinessproperties.com
While we strive to provide the most accurate information, all listing information, and demographic data, is provided by third-parties. As such, MyEListing will not be responsible for the accuracy of the information. It is strongly recommended that you verify all information with the listing agent, and any relevant agencies, prior to making any decisions.


