Industrial Properties
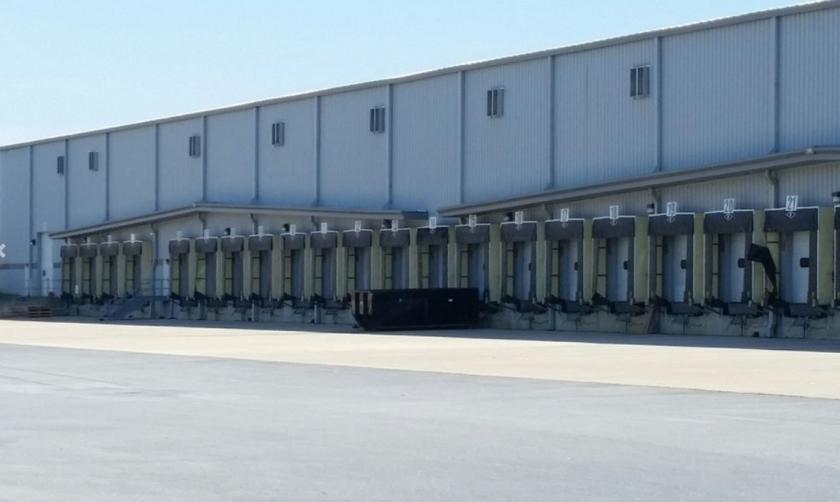
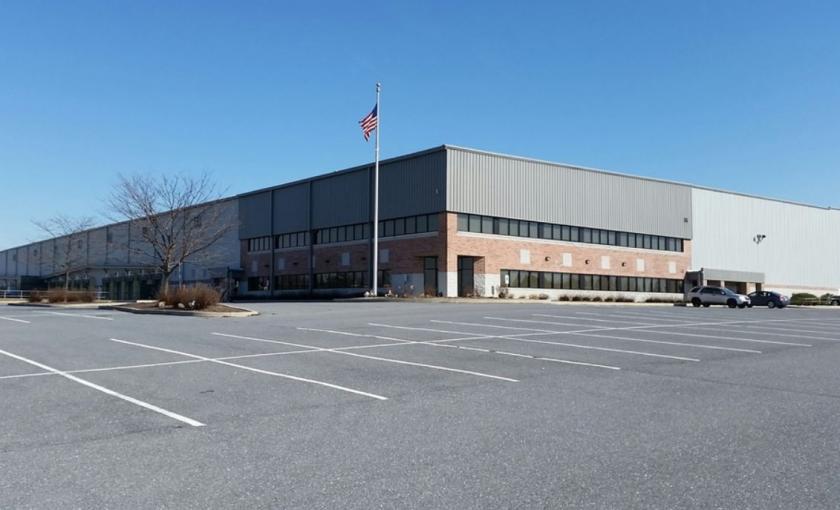
1156 4 Star Drive Mount Joy, PA 17552
1156 4 Star Drive Mount Joy, PA 17552
Details & Description
Listing Agents

Jack Shepley
O: 717-761-5070
M: 717-645-2254
jshepley@ipg-cir.com
O: 717-761-5070
M: 717-645-2254
jshepley@ipg-cir.com
While we strive to provide the most accurate information, all listing information, and demographic data, is provided by third-parties. As such, MyEListing will not be responsible for the accuracy of the information. It is strongly recommended that you verify all information with the listing agent, and any relevant agencies, prior to making any decisions.