Commercial Land
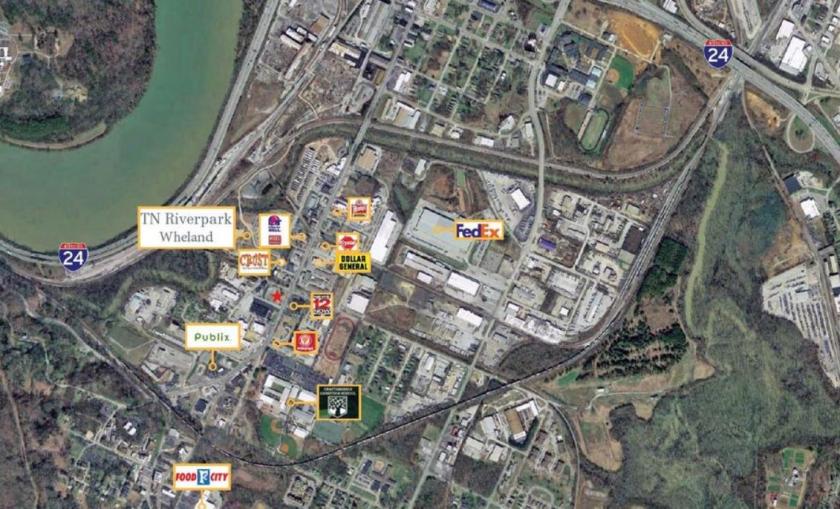
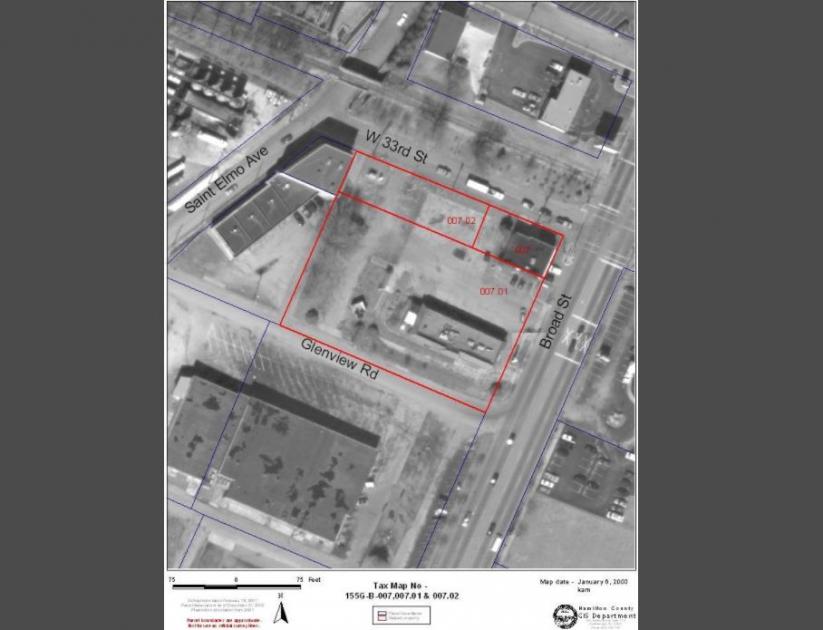
3301 Broad Street Chattanooga, TN 37408
3301 Broad Street Chattanooga, TN 37408
Details & Description
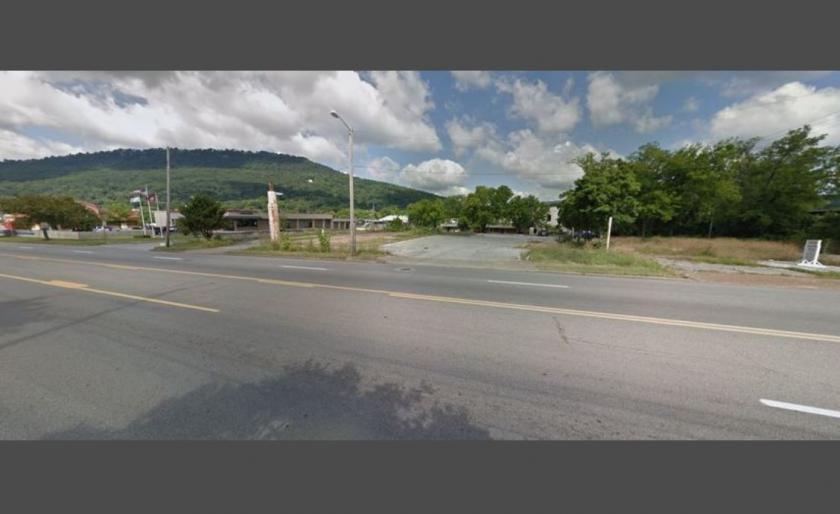
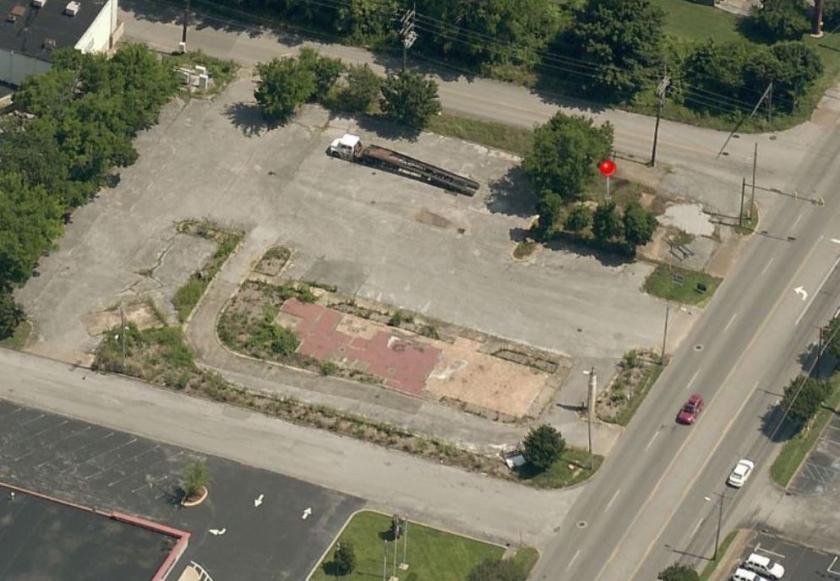
Additional Photos
Listing Agents

Robert Maclellan
O: 423-454-3104
M: 423-432-0963
rmaclellan@risepartners.net
O: 423-454-3104
M: 423-432-0963
rmaclellan@risepartners.net
While we strive to provide the most accurate information, all listing information, and demographic data, is provided by third-parties. As such, MyEListing will not be responsible for the accuracy of the information. It is strongly recommended that you verify all information with the listing agent, and any relevant agencies, prior to making any decisions.


