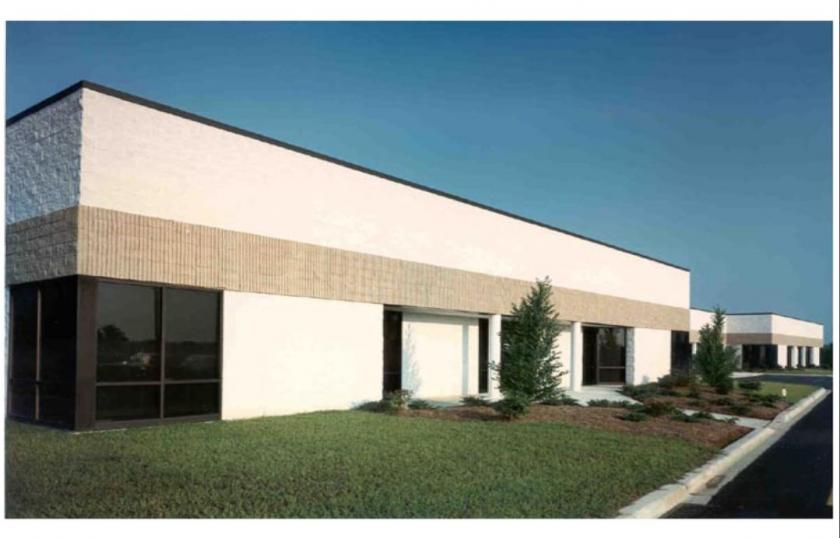
1-Mile | 3-Miles | 5-Miles | ||
---|---|---|---|---|
Total Population | 4,701 | 60,606 | 208,207 | |
Population Median Age | 40 | 39 | 39 | |
Population by Age | 0-9 Yrs | 599 (12%) | 7244 (11%) | 24930 (11%) |
10-19 Yrs | 522 (11%) | 6891 (11%) | 24843 (11%) | |
20-29 Yrs | 587 (12%) | 8519 (14%) | 28790 (13%) | |
30-39 Yrs | 750 (15%) | 8570 (14%) | 30652 (14%) | |
40-49 Yrs | 472 (10%) | 7119 (11%) | 25745 (12%) | |
50-59 Yrs | 714 (15%) | 8959 (14%) | 30139 (14%) | |
60-69 Yrs | 539 (11%) | 6869 (11%) | 22959 (11%) | |
70+ Yrs | 518 (11%) | 6435 (10%) | 20150 (9%) | |
Median HH Income | $61,670 | $66,442 | $64,371 | |
Total Household Income | < 24K | 342 (18%) | 3763 (16%) | 14254 (17%) |
25-49K | 456 (24%) | 4707 (20%) | 16379 (20%) | |
50-74K | 306 (16%) | 4444 (19%) | 15339 (19%) | |
75-99K | 348 (18%) | 3736 (16%) | 11831 (14%) | |
100-199K | 423 (22%) | 5380 (23%) | 17870 (22%) | |
200K+ | 24 (1%) | 742 (3%) | 4306 (5%) | |
Highest Education Level | No Diploma | 421 | 5583 | 16047 |
Diploma or GED | 1442 | 16622 | 52522 | |
Some College | 579 | 7661 | 26052 | |
Assoc. Degree | 218 | 3190 | 10264 | |
Bachelors Degree | 466 | 6681 | 25026 | |
Higher Degree | 274 | 3424 | 16257 | |
Total Housing Units | 2,092 | 24,702 | 87,123 | |
--Owner-Occupied | 1,192 | 16,561 | 51,133 | |
--Renter-Occupied | 707 | 6,211 | 28,847 | |
Owner-Occupied Values | < 100K | 123 | 1166 | 3636 |
100-199K | 437 | 5681 | 18734 | |
200-299K | 537 | 8006 | 19500 | |
300-399K | 84 | 1060 | 4778 | |
400-499K | 1 | 212 | 2056 | |
500K+ | 10 | 435 | 2429 | |
Total Working Age Population | 3,785 | 49,303 | 167,798 | |
In Work Force | 2,490 | 32,320 | 112,357 | |
Not In Work Force | 1,295 | 16,983 | 55,441 | |
Workforce Employed | 2,309 | 30,169 | 105,462 | |
Workforce Unemployed | 178 | 2,123 | 6,671 | |
Civlian Workforce | 2,486 | 32,293 | 112,133 | |
Military Workforce | 4 | 28 | 224 | |
Total Households | 1,899 | 22,772 | 79,980 | |
Family Households | 1,178 | 14,876 | 50,018 | |
Non-Family Households | 721 | 7,895 | 29,962 | |
Married Couple | 805 | 10,529 | 33,397 | |
Other Family | 373 | 4,347 | 16,622 | |
Married w/Child | 250 | 3,659 | 11,477 | |
Single Male w/Child | 59 | 383 | 2,051 | |
Single Female w/Child | 160 | 1,607 | 6,019 |
Population Change Last Two Decades - Plus Projection
2000 | % | 2010 | % | 2020 | % | 2030 | |
---|---|---|---|---|---|---|---|
Delaware | 783,600 | +15 | 897,934 | +10 | 989,803 | +6 | 1,044,965 |
New Castle County | 500,265 | +8 | 538,479 | +6 | 571,165 | +4 | 596,221 |
New Jersey | 8,414,350 | +4 | 8,791,894 | +4 | 9,132,700 | +4 | 9,530,900 |
Salem County | 64,285 | +3 | 66,083 | -5 | 63,000 | -3 | 61,000 |
Pennsylvania | 12,281,054 | +3 | 12,702,379 | +4 | 13,230,170 | +4 | 13,759,594 |
Chester County | 433,501 | +15 | 498,886 | +7 | 533,837 | +7 | 573,576 |
Total Working Age Population:
Total Households:
Total Working Age Population:
Total Households:
Total Working Age Population:
Total Households: