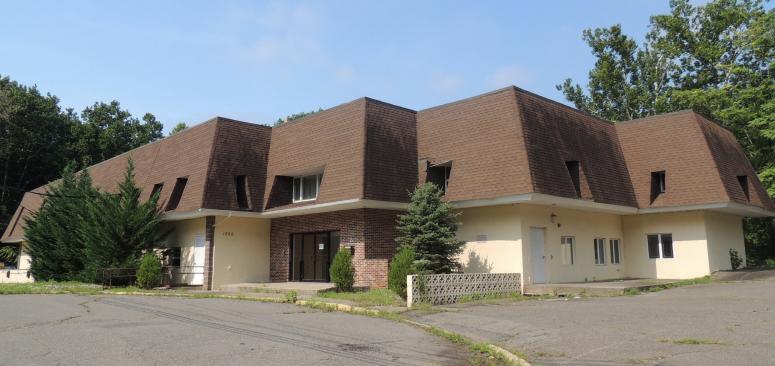
Office Space
1500 Cardinal Drive Little Falls, NJ 07424
1500 Cardinal Drive Little Falls, NJ 07424
Details & Description
Property Highlights
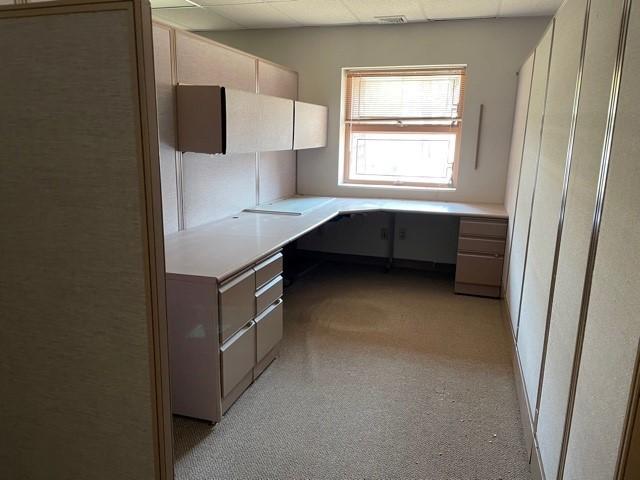
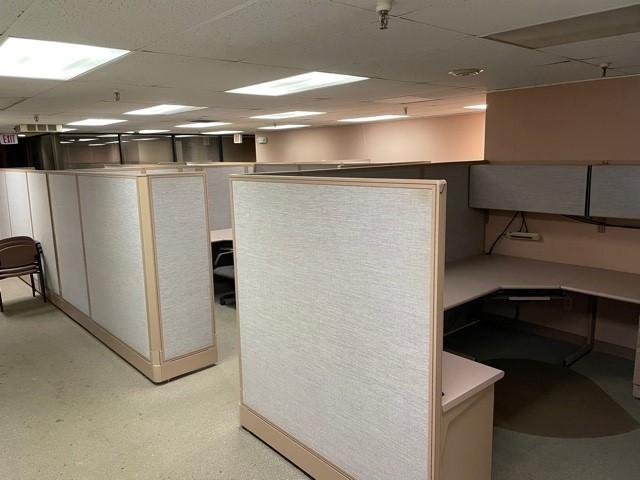
• 8,000 SF Professional Office
• 8,000 SF Professional Office
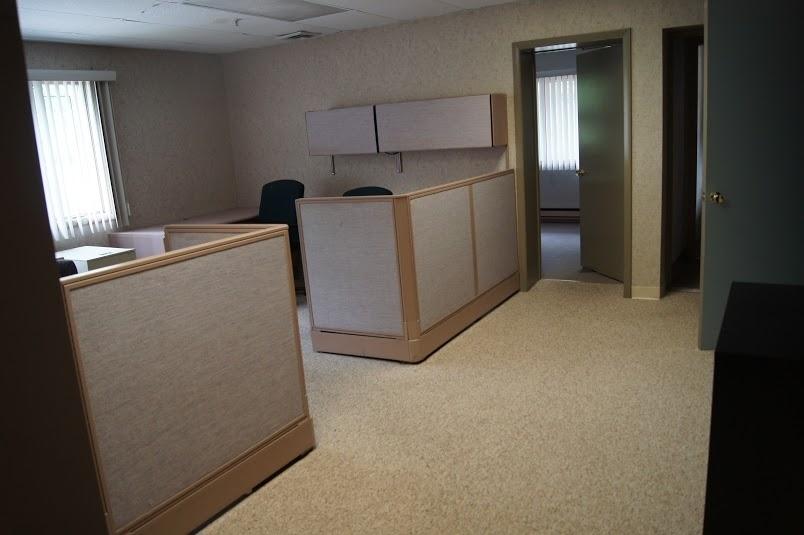
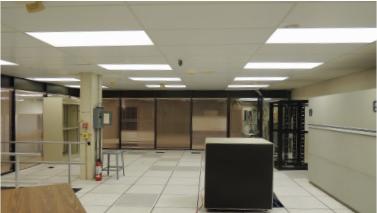
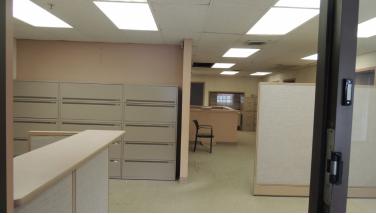
Additional Photos
Listing Agents

Troy Schaafsma
O: 973-379-6644
M: 973-906-5112
troys@blauberg.com
O: 973-379-6644
M: 973-906-5112
troys@blauberg.com
While we strive to provide the most accurate information, all listing information, and demographic data, is provided by third-parties. As such, MyEListing will not be responsible for the accuracy of the information. It is strongly recommended that you verify all information with the listing agent, and any relevant agencies, prior to making any decisions.