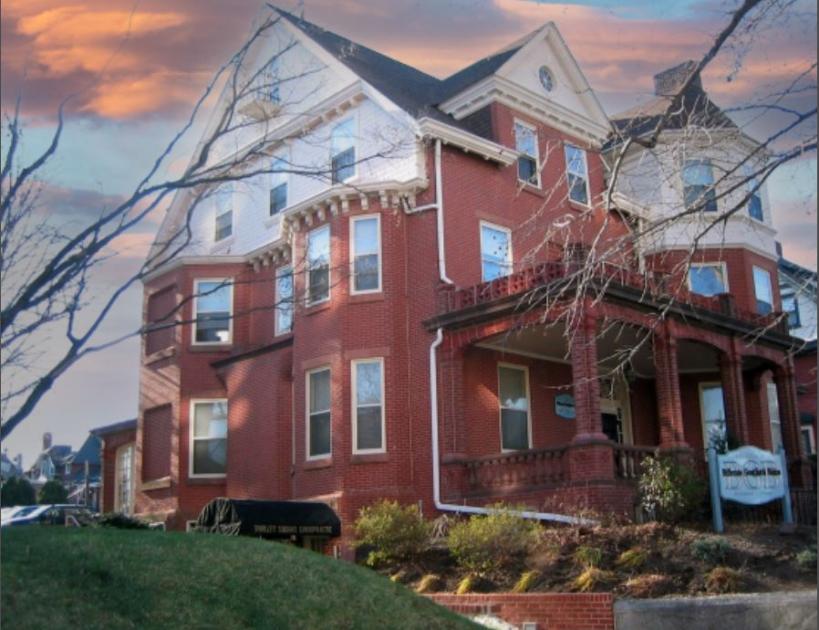
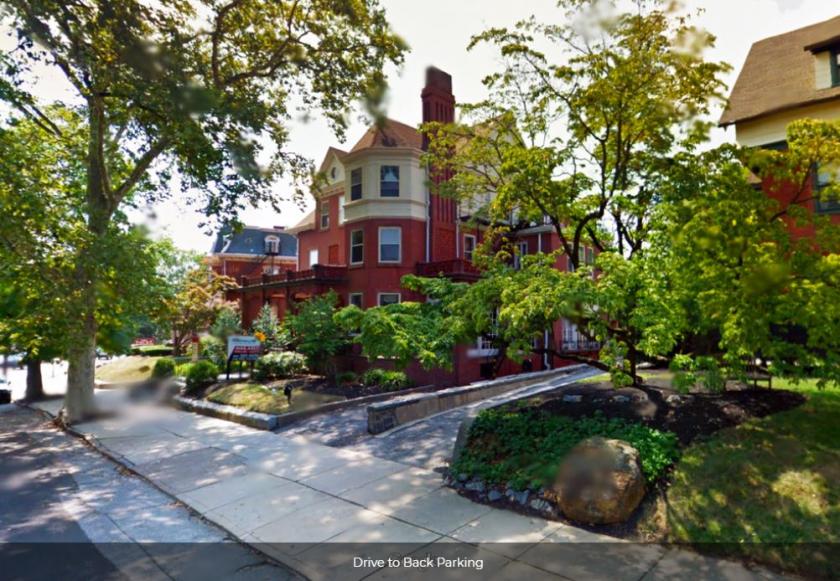
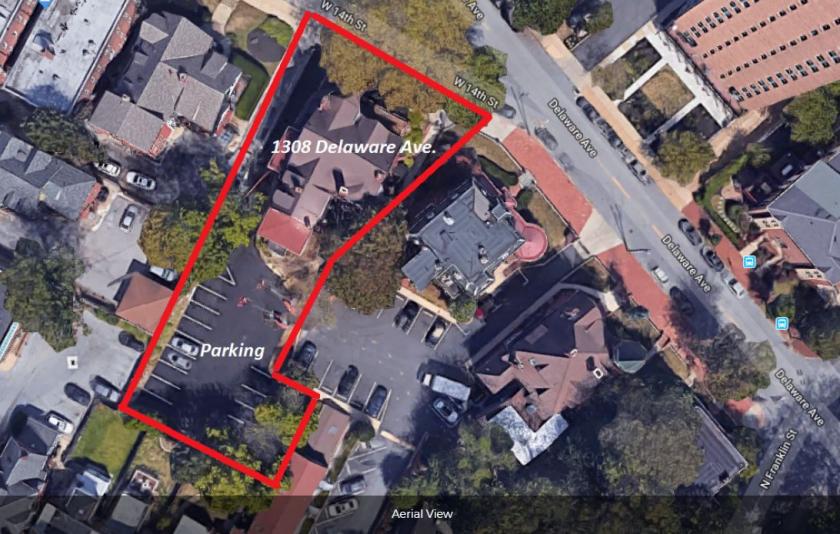
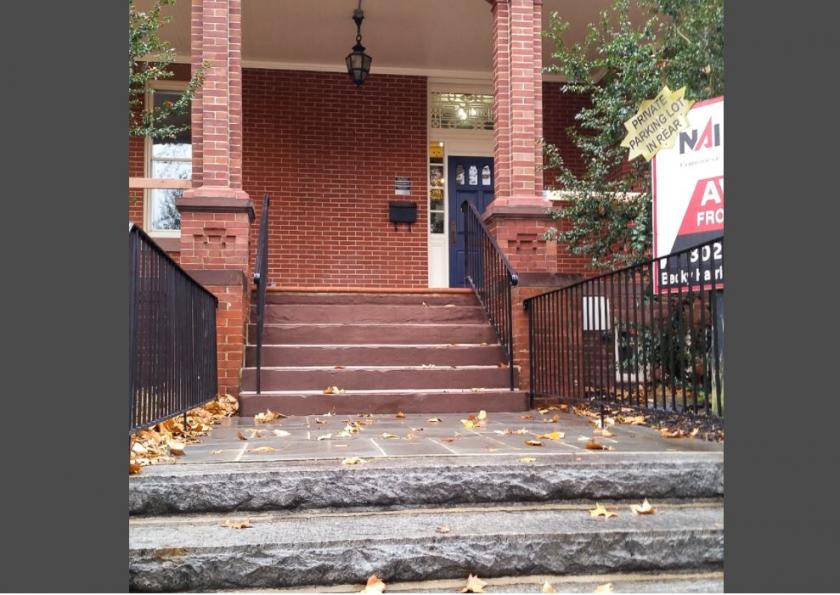
1-Mile | 3-Miles | 5-Miles | ||
---|---|---|---|---|
Total Population | 30,979 | 110,868 | 193,225 | |
Population Median Age | 38 | 38 | 39 | |
Population by Age | 0-9 Yrs | 3261 (10%) | 13813 (12%) | 23394 (12%) |
10-19 Yrs | 3347 (10%) | 13823 (12%) | 23824 (12%) | |
20-29 Yrs | 5820 (18%) | 16831 (15%) | 26832 (13%) | |
30-39 Yrs | 5030 (16%) | 16884 (15%) | 27375 (14%) | |
40-49 Yrs | 3565 (11%) | 12678 (11%) | 22865 (11%) | |
50-59 Yrs | 3546 (11%) | 14406 (12%) | 26214 (13%) | |
60-69 Yrs | 3351 (10%) | 11981 (10%) | 21739 (11%) | |
70+ Yrs | 3060 (9%) | 10450 (9%) | 20982 (10%) | |
Median HH Income | $50,378 | $52,598 | $59,949 | |
Total Household Income | < 24K | 3954 (27%) | 11919 (26%) | 16760 (22%) |
25-49K | 3073 (21%) | 9554 (21%) | 15679 (20%) | |
50-74K | 2381 (16%) | 7055 (15%) | 11981 (15%) | |
75-99K | 1455 (10%) | 5247 (11%) | 9688 (12%) | |
100-199K | 2445 (17%) | 7878 (17%) | 15691 (20%) | |
200K+ | 825 (5%) | 2912 (6%) | 5407 (7%) | |
Highest Education Level | No Diploma | 2353 | 9052 | 15195 |
Diploma or GED | 7141 | 27679 | 46200 | |
Some College | 3534 | 12136 | 22460 | |
Assoc. Degree | 1052 | 3929 | 7530 | |
Bachelors Degree | 4549 | 13640 | 25397 | |
Higher Degree | 3322 | 10043 | 18502 | |
Total Housing Units | 16,808 | 51,504 | 84,475 | |
--Owner-Occupied | 5,756 | 22,668 | 45,651 | |
--Renter-Occupied | 8,376 | 21,897 | 29,555 | |
Owner-Occupied Values | < 100K | 897 | 3125 | 4394 |
100-199K | 1848 | 8952 | 15390 | |
200-299K | 1268 | 4786 | 11743 | |
300-399K | 853 | 2087 | 6182 | |
400-499K | 281 | 1129 | 3075 | |
500K+ | 609 | 2589 | 4868 | |
Total Working Age Population | 25,305 | 88,280 | 154,510 | |
In Work Force | 16,900 | 55,871 | 97,319 | |
Not In Work Force | 8,406 | 32,410 | 57,191 | |
Workforce Employed | 15,698 | 51,620 | 90,322 | |
Workforce Unemployed | 1,115 | 4,087 | 6,752 | |
Civlian Workforce | 16,813 | 55,707 | 97,074 | |
Military Workforce | 87 | 164 | 245 | |
Total Households | 14,132 | 44,565 | 75,206 | |
Family Households | 5,977 | 23,938 | 43,935 | |
Non-Family Households | 8,155 | 20,627 | 31,271 | |
Married Couple | 2,983 | 12,532 | 26,964 | |
Other Family | 2,994 | 11,406 | 16,971 | |
Married w/Child | 1,013 | 4,576 | 9,787 | |
Single Male w/Child | 343 | 1,069 | 1,710 | |
Single Female w/Child | 1,104 | 4,797 | 6,626 |
Population Change Last Two Decades - Plus Projection
2000 | % | 2010 | % | 2020 | % | 2030 | |
---|---|---|---|---|---|---|---|
Delaware | 783,600 | +15 | 897,934 | +10 | 989,803 | +6 | 1,044,965 |
New Castle County | 500,265 | +8 | 538,479 | +6 | 571,165 | +4 | 596,221 |
New Jersey | 8,414,350 | +4 | 8,791,894 | +4 | 9,132,700 | +4 | 9,530,900 |
Salem County | 64,285 | +3 | 66,083 | -5 | 63,000 | -3 | 61,000 |
Pennsylvania | 12,281,054 | +3 | 12,702,379 | +4 | 13,230,170 | +4 | 13,759,594 |
Chester County | 433,501 | +15 | 498,886 | +7 | 533,837 | +7 | 573,576 |
Delaware County | 550,864 | +1 | 558,979 | +5 | 588,436 | +6 | 622,307 |
Total Working Age Population:
Total Households:
Total Working Age Population:
Total Households:
Total Working Age Population:
Total Households: