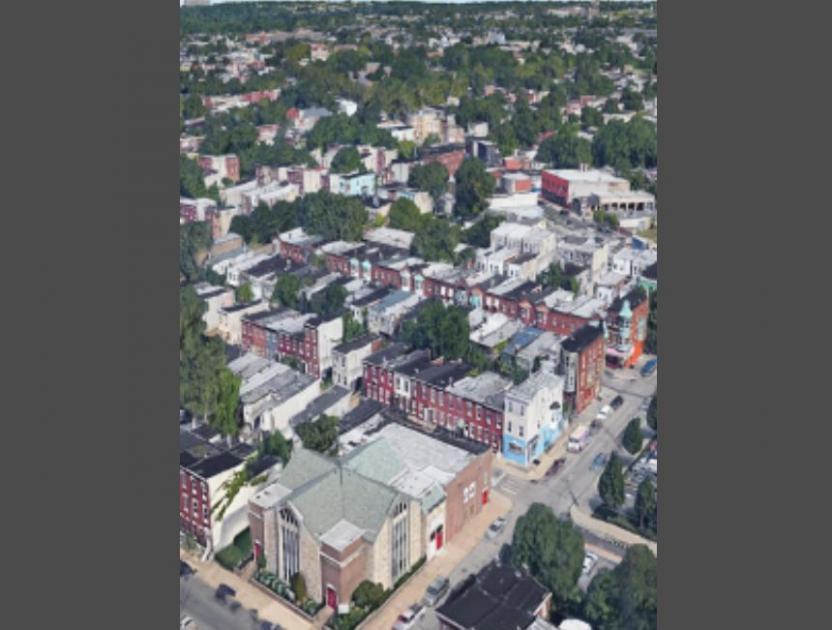
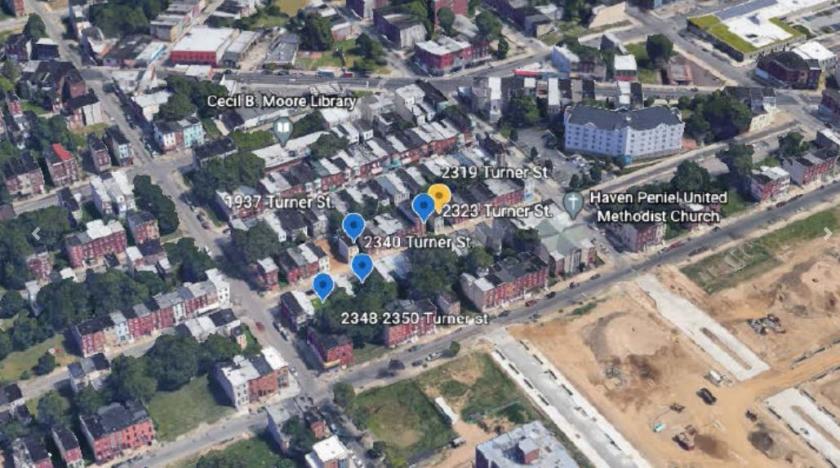
1-Mile | 3-Miles | 5-Miles | ||
---|---|---|---|---|
Total Population | 58,712 | 432,840 | 1,066,479 | |
Population Median Age | 36 | 36 | 36 | |
Population by Age | 0-9 Yrs | 5776 (9%) | 45733 (10%) | 131426 (12%) |
10-19 Yrs | 7558 (12%) | 48492 (11%) | 131889 (12%) | |
20-29 Yrs | 14399 (24%) | 103151 (23%) | 208702 (19%) | |
30-39 Yrs | 8216 (13%) | 72889 (16%) | 169127 (15%) | |
40-49 Yrs | 5028 (8%) | 42586 (9%) | 115845 (10%) | |
50-59 Yrs | 6987 (11%) | 45556 (10%) | 120227 (11%) | |
60-69 Yrs | 6103 (10%) | 39154 (9%) | 101816 (9%) | |
70+ Yrs | 4643 (7%) | 35280 (8%) | 87447 (8%) | |
Median HH Income | $35,615 | $46,303 | $43,234 | |
Total Household Income | < 24K | 9865 (40%) | 60140 (33%) | 137960 (33%) |
25-49K | 4376 (18%) | 34595 (19%) | 89732 (21%) | |
50-74K | 3002 (12%) | 25080 (13%) | 60496 (14%) | |
75-99K | 2007 (8%) | 16878 (9%) | 39596 (9%) | |
100-199K | 3459 (14%) | 29621 (16%) | 61552 (14%) | |
200K+ | 1353 (5%) | 14769 (8%) | 24518 (5%) | |
Highest Education Level | No Diploma | 5454 | 43348 | 117078 |
Diploma or GED | 11430 | 71270 | 213438 | |
Some College | 6059 | 39906 | 112315 | |
Assoc. Degree | 1467 | 11394 | 34725 | |
Bachelors Degree | 7307 | 67085 | 131158 | |
Higher Degree | 6219 | 62013 | 106987 | |
Total Housing Units | 30,041 | 214,799 | 483,937 | |
--Owner-Occupied | 10,008 | 73,552 | 198,603 | |
--Renter-Occupied | 14,053 | 107,531 | 215,251 | |
Owner-Occupied Values | < 100K | 3151 | 23928 | 67125 |
100-199K | 1727 | 11627 | 52034 | |
200-299K | 1588 | 10377 | 30378 | |
300-399K | 1321 | 8670 | 17279 | |
400-499K | 881 | 5855 | 10327 | |
500K+ | 1341 | 13094 | 21459 | |
Total Working Age Population | 49,559 | 365,973 | 861,980 | |
In Work Force | 29,073 | 219,592 | 519,490 | |
Not In Work Force | 20,486 | 146,381 | 342,490 | |
Workforce Employed | 25,780 | 202,274 | 471,895 | |
Workforce Unemployed | 3,275 | 17,175 | 47,310 | |
Civlian Workforce | 29,055 | 219,448 | 519,205 | |
Military Workforce | 18 | 143 | 286 | |
Total Households | 24,061 | 181,083 | 413,854 | |
Family Households | 10,566 | 75,426 | 207,700 | |
Non-Family Households | 13,496 | 105,656 | 206,155 | |
Married Couple | 4,285 | 38,438 | 100,254 | |
Other Family | 6,281 | 36,988 | 107,445 | |
Married w/Child | 1,312 | 11,881 | 35,698 | |
Single Male w/Child | 414 | 2,971 | 9,292 | |
Single Female w/Child | 2,549 | 14,378 | 42,340 |
Population Change Last Two Decades - Plus Projection
2000 | % | 2010 | % | 2020 | % | 2030 | |
---|---|---|---|---|---|---|---|
New Jersey | 8,414,350 | +4 | 8,791,894 | +4 | 9,132,700 | +4 | 9,530,900 |
Camden County | 508,932 | +1 | 513,657 | 0 | 511,800 | +2 | 521,000 |
Pennsylvania | 12,281,054 | +3 | 12,702,379 | +4 | 13,230,170 | +4 | 13,759,594 |
Bucks County | 597,635 | +5 | 625,249 | +1 | 629,420 | +1 | 637,730 |
Delaware County | 550,864 | +1 | 558,979 | +5 | 588,436 | +6 | 622,307 |
Montgomery County | 750,097 | +7 | 799,874 | +5 | 838,883 | +6 | 891,868 |
Philadelphia County | 1,517,550 | +1 | 1,526,006 | +8 | 1,653,729 | +6 | 1,753,054 |
Total Working Age Population:
Total Households:
Total Working Age Population:
Total Households:
Total Working Age Population:
Total Households: