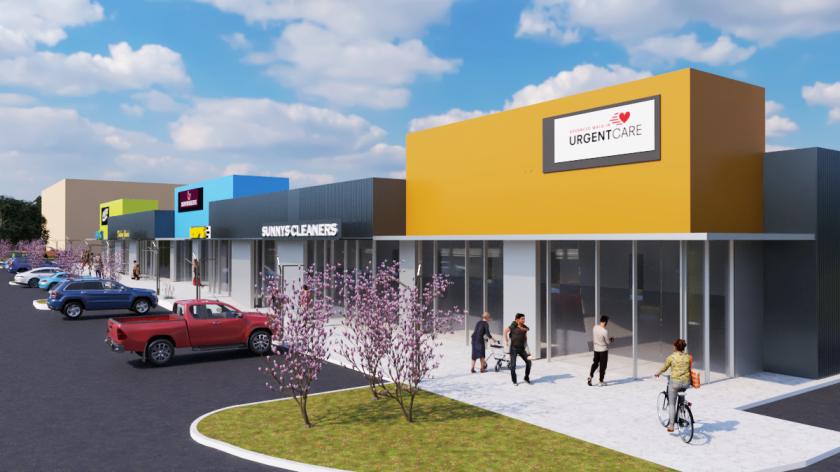
Retail Space
114 Grand Avenue Parkway Pflugerville, TX 78660
114 Grand Avenue Parkway Pflugerville, TX 78660
Details & Description
Property Highlights
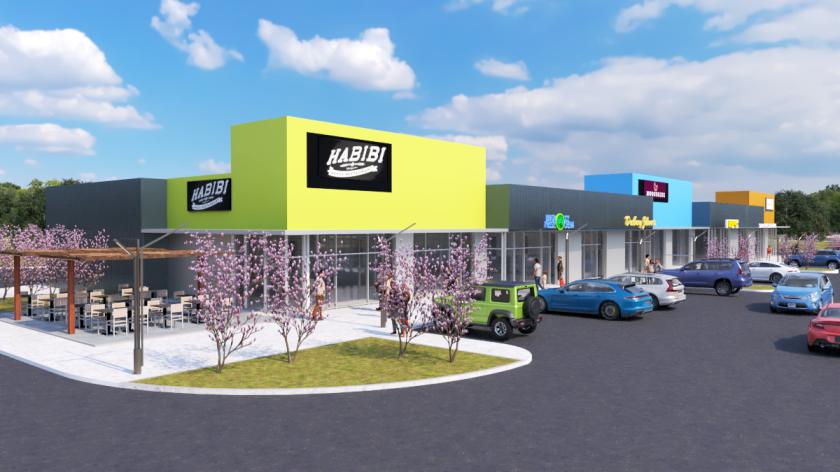
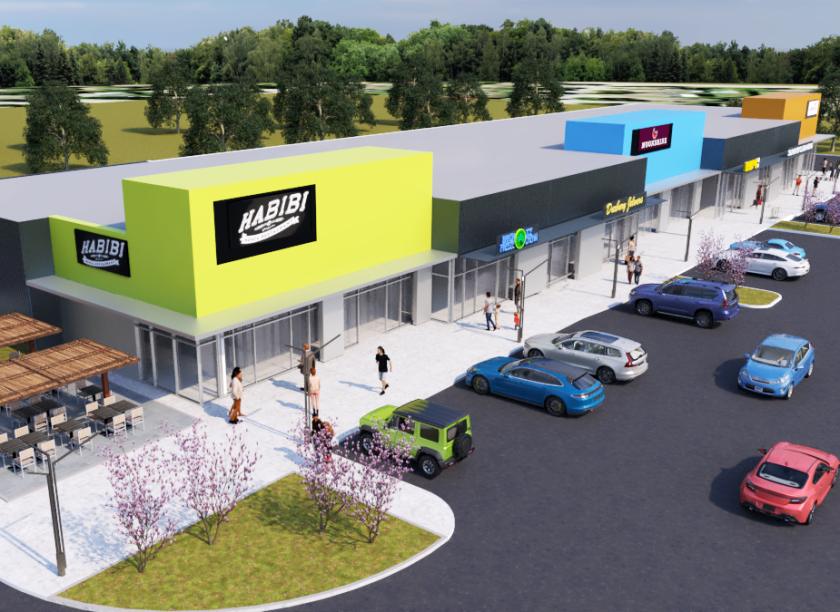
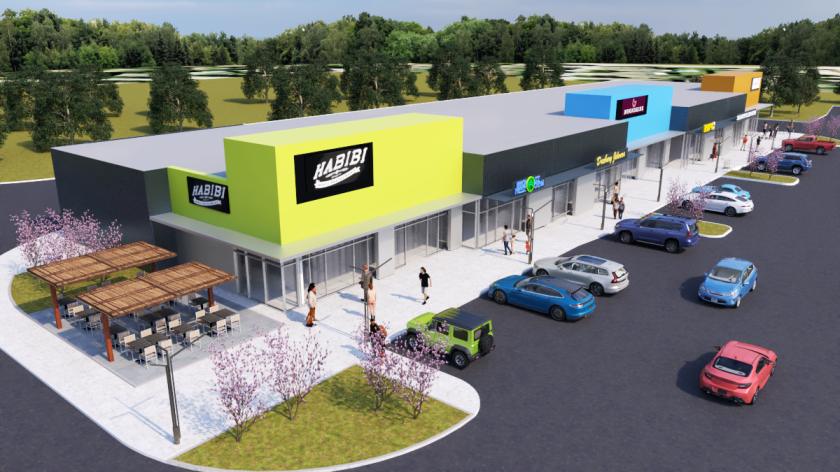
- • New construction
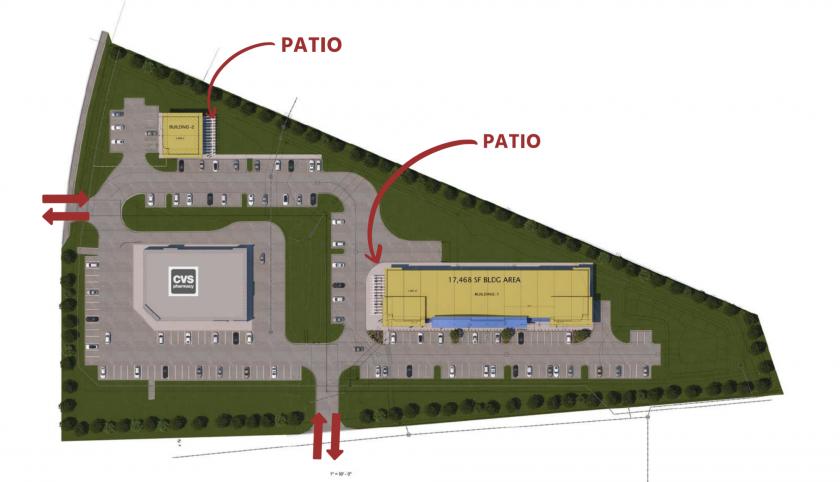
- • Hard corner at a lighted intersection.
- • Endcap restaurant space available with patio
- • 57,000 Households within 3 miles
- • At a lighted intersection with multiple access
- • Landlord Finish-out Options AVAILABLE CALL US NOW
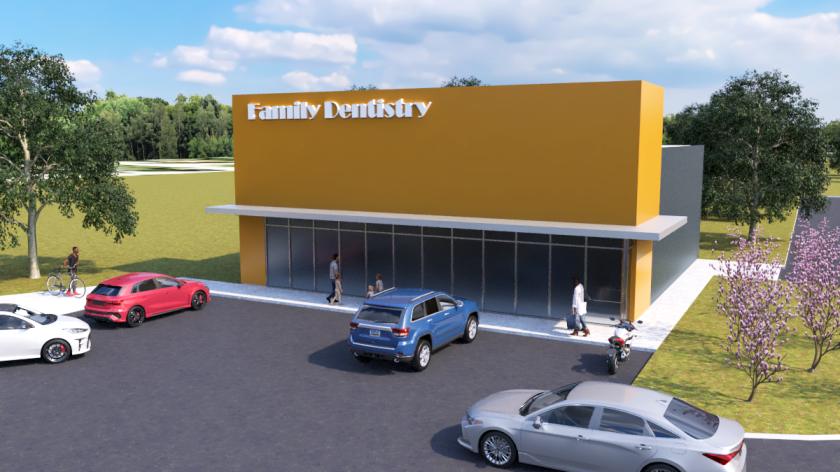
Additional Photos
Listing Agents

Lezlie Tram Le
O: 512-490-6666
lezlie@ltcommercialgroup.com
O: 512-490-6666
lezlie@ltcommercialgroup.com
While we strive to provide the most accurate information, all listing information, and demographic data, is provided by third-parties. As such, MyEListing will not be responsible for the accuracy of the information. It is strongly recommended that you verify all information with the listing agent, and any relevant agencies, prior to making any decisions.