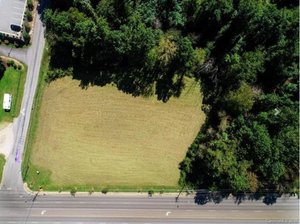
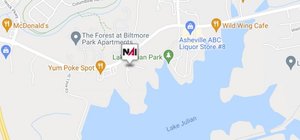
1-Mile | 3-Miles | 5-Miles | ||
---|---|---|---|---|
Total Population | 3,393 | 13,850 | 22,653 | |
Population Median Age | 44 | 46 | 47 | |
Population by Age | 0-9 Yrs | 376 (11%) | 1119 (8%) | 1702 (7%) |
10-19 Yrs | 320 (9%) | 1428 (10%) | 2313 (10%) | |
20-29 Yrs | 307 (9%) | 1294 (9%) | 2031 (8%) | |
30-39 Yrs | 542 (15%) | 1629 (11%) | 2394 (10%) | |
40-49 Yrs | 303 (8%) | 1516 (10%) | 2652 (11%) | |
50-59 Yrs | 416 (12%) | 2005 (14%) | 3255 (14%) | |
60-69 Yrs | 477 (14%) | 2276 (16%) | 3857 (17%) | |
70+ Yrs | 651 (19%) | 2584 (18%) | 4449 (19%) | |
Median HH Income | $38,932 | $44,406 | $50,812 | |
Total Household Income | < 24K | 542 (31%) | 1759 (26%) | 2531 (24%) |
25-49K | 486 (28%) | 1780 (27%) | 2664 (25%) | |
50-74K | 255 (14%) | 1222 (18%) | 2070 (19%) | |
75-99K | 270 (15%) | 828 (12%) | 1410 (13%) | |
100-199K | 156 (9%) | 743 (11%) | 1407 (13%) | |
200K+ | 15 (0%) | 232 (3%) | 412 (3%) | |
Highest Education Level | No Diploma | 522 | 1758 | 2248 |
Diploma or GED | 575 | 2283 | 4071 | |
Some College | 585 | 2347 | 3821 | |
Assoc. Degree | 189 | 1007 | 1935 | |
Bachelors Degree | 294 | 1649 | 3071 | |
Higher Degree | 339 | 1422 | 2365 | |
Total Housing Units | 1,988 | 7,925 | 13,979 | |
--Owner-Occupied | 831 | 4,145 | 7,304 | |
--Renter-Occupied | 893 | 2,419 | 3,190 | |
Owner-Occupied Values | < 100K | 218 | 940 | 1434 |
100-199K | 330 | 1524 | 2461 | |
200-299K | 145 | 844 | 1613 | |
300-399K | 53 | 379 | 945 | |
400-499K | 7 | 149 | 333 | |
500K+ | 77 | 308 | 518 | |
Total Working Age Population | 2,822 | 11,808 | 19,482 | |
In Work Force | 1,642 | 6,219 | 10,471 | |
Not In Work Force | 1,180 | 5,589 | 9,012 | |
Workforce Employed | 1,575 | 6,013 | 10,061 | |
Workforce Unemployed | 67 | 206 | 408 | |
Civlian Workforce | 1,642 | 6,219 | 10,469 | |
Military Workforce | 0 | 0 | 2 | |
Total Households | 1,724 | 6,564 | 10,494 | |
Family Households | 934 | 3,717 | 6,296 | |
Non-Family Households | 790 | 2,847 | 4,199 | |
Married Couple | 688 | 2,878 | 5,045 | |
Other Family | 246 | 840 | 1,251 | |
Married w/Child | 235 | 863 | 1,383 | |
Single Male w/Child | 16 | 64 | 96 | |
Single Female w/Child | 139 | 386 | 573 |
Population Change Last Two Decades - Plus Projection
2000 | % | 2010 | % | 2020 | % | 2030 | |
---|---|---|---|---|---|---|---|
North Carolina | 8,049,313 | +18 | 9,535,483 | +11 | 10,630,691 | +11 | 11,836,070 |
Haywood County | 54,033 | +9 | 59,036 | +8 | 63,813 | +8 | 68,680 |
Jackson County | 33,121 | +22 | 40,271 | +11 | 44,848 | +11 | 49,995 |
Transylvania County | 29,334 | +13 | 33,090 | +8 | 35,806 | +8 | 38,768 |
Total Working Age Population:
Total Households:
Total Working Age Population:
Total Households:
Total Working Age Population:
Total Households: