Industrial Properties
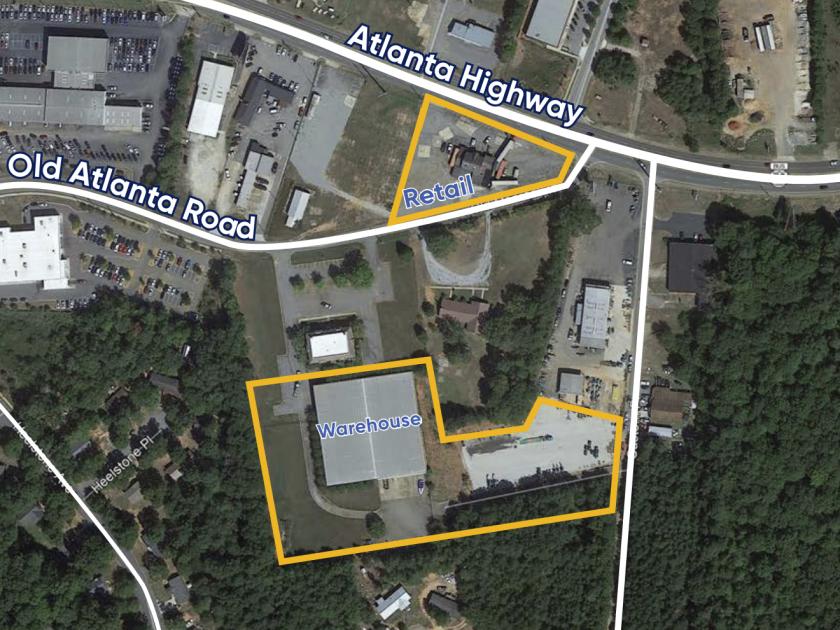
125 Old Monroe Road Bogart, GA 30622
125 Old Monroe Road Bogart, GA 30622
Details & Description
Listing Agents

Scott Hardeman
O: 404-446-1863
M: 352-359-7494
shardeman@cresa.com
O: 404-446-1863
M: 352-359-7494
shardeman@cresa.com
While we strive to provide the most accurate information, all listing information, and demographic data, is provided by third-parties. As such, MyEListing will not be responsible for the accuracy of the information. It is strongly recommended that you verify all information with the listing agent, and any relevant agencies, prior to making any decisions.