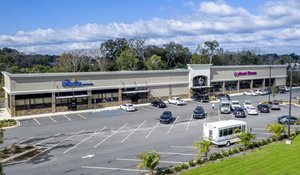
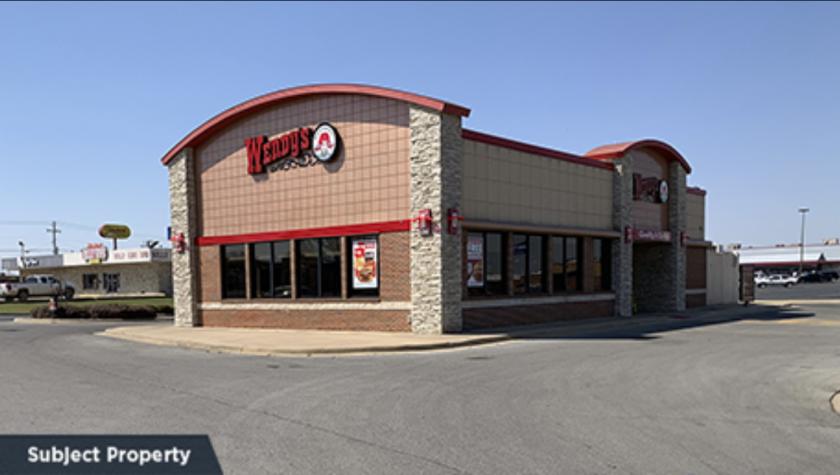
1-Mile | 3-Miles | 5-Miles | ||
---|---|---|---|---|
Total Population | 2,785 | 17,394 | 24,040 | |
Population Median Age | 38 | 36 | 37 | |
Population by Age | 0-9 Yrs | 322 (11%) | 2326 (13%) | 3341 (13%) |
10-19 Yrs | 405 (14%) | 2438 (14%) | 3284 (13%) | |
20-29 Yrs | 432 (15%) | 3235 (18%) | 4159 (17%) | |
30-39 Yrs | 414 (14%) | 2362 (13%) | 3220 (13%) | |
40-49 Yrs | 242 (8%) | 1835 (10%) | 2560 (10%) | |
50-59 Yrs | 318 (11%) | 1712 (9%) | 2491 (10%) | |
60-69 Yrs | 397 (14%) | 1826 (10%) | 2577 (10%) | |
70+ Yrs | 256 (9%) | 1660 (9%) | 2408 (10%) | |
Median HH Income | $47,369 | $39,966 | $41,421 | |
Total Household Income | < 24K | 257 (25%) | 1955 (30%) | 2645 (29%) |
25-49K | 275 (27%) | 1914 (29%) | 2566 (28%) | |
50-74K | 191 (18%) | 1070 (16%) | 1545 (17%) | |
75-99K | 103 (10%) | 614 (9%) | 864 (9%) | |
100-199K | 158 (15%) | 693 (10%) | 1043 (11%) | |
200K+ | 25 (2%) | 190 (2%) | 275 (3%) | |
Highest Education Level | No Diploma | 235 | 1712 | 2237 |
Diploma or GED | 454 | 3124 | 4526 | |
Some College | 552 | 2707 | 3864 | |
Assoc. Degree | 90 | 505 | 797 | |
Bachelors Degree | 321 | 1755 | 2306 | |
Higher Degree | 179 | 1138 | 1516 | |
Total Housing Units | 1,101 | 7,303 | 10,075 | |
--Owner-Occupied | 455 | 2,869 | 4,446 | |
--Renter-Occupied | 555 | 3,567 | 4,492 | |
Owner-Occupied Values | < 100K | 100 | 934 | 1453 |
100-199K | 278 | 1321 | 1973 | |
200-299K | 49 | 350 | 556 | |
300-399K | 16 | 130 | 235 | |
400-499K | 11 | 69 | 100 | |
500K+ | 1 | 64 | 128 | |
Total Working Age Population | 2,200 | 13,820 | 18,911 | |
In Work Force | 1,394 | 8,213 | 11,088 | |
Not In Work Force | 806 | 5,607 | 7,824 | |
Workforce Employed | 1,315 | 7,696 | 10,430 | |
Workforce Unemployed | 78 | 517 | 658 | |
Civlian Workforce | 1,394 | 8,213 | 11,088 | |
Military Workforce | 0 | 0 | 0 | |
Total Households | 1,009 | 6,436 | 8,938 | |
Family Households | 606 | 3,802 | 5,432 | |
Non-Family Households | 404 | 2,634 | 3,506 | |
Married Couple | 420 | 2,422 | 3,573 | |
Other Family | 186 | 1,381 | 1,860 | |
Married w/Child | 133 | 998 | 1,476 | |
Single Male w/Child | 17 | 171 | 230 | |
Single Female w/Child | 70 | 484 | 636 |
Population Change Last Two Decades - Plus Projection
2000 | % | 2010 | % | 2020 | % | 2030 | |
---|---|---|---|---|---|---|---|
Oklahoma | 3,450,654 | +9 | 3,751,351 | +7 | 4,024,202 | +7 | 4,302,501 |
Bryan County | 36,534 | +16 | 42,416 | +8 | 45,741 | +7 | 49,166 |
Texas | 20,851,820 | +21 | 25,145,561 | +18 | 29,677,668 | +18 | 34,894,452 |
Grayson County | 110,595 | +9 | 120,877 | +9 | 131,710 | +7 | 140,903 |
Total Working Age Population:
Total Households:
Total Working Age Population:
Total Households:
Total Working Age Population:
Total Households: