Industrial Properties
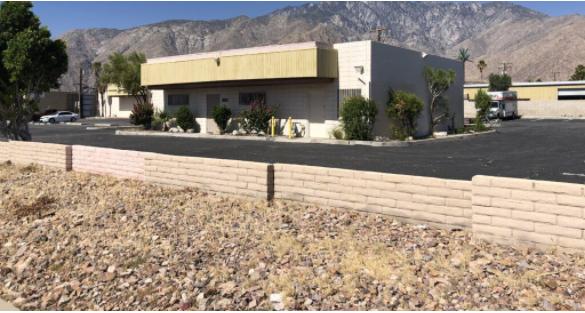
3455 North Indian Canyon Drive Palm Springs, CA 92262
3455 North Indian Canyon Drive Palm Springs, CA 92262
Details & Description
Listing Agents

Kenneth Hulbert
O: 949-242-1702
ken.hulbert@daumcommercial.com
O: 949-242-1702
ken.hulbert@daumcommercial.com
While we strive to provide the most accurate information, all listing information, and demographic data, is provided by third-parties. As such, MyEListing will not be responsible for the accuracy of the information. It is strongly recommended that you verify all information with the listing agent, and any relevant agencies, prior to making any decisions.


