26.34+/- Acres (subject to survey) see attached “Property Plat”
• 1,898'+/- Road Frontage
• Rail Served. 1,285’+/- Abutting Union Pacific RR R/W
• Mostly cleared, generally level, at or near street grade, appears well drained
• 18+/- Acres under fence & partly stabilized for “Lay Down” Yard
LOCATION HIGHLIGHTS
• 750 Aero Dr., Shreveport, LA 71107
• 1.5 miles north of Shreveport’s downtown CBD
• Excellent location in heart of Shreveport’s Agurs Industrial District
• Great access – only minutes to N. Market St. (Hwy 1 & 71), N. Hearne Ave. (Hwy 3094), I-20, I-220 & I-49
• Shreveport (190,000 pop.) is parish seat for Caddo Parish (240,000 pop.) and in 4-parish M.S.A. (432,000 pop.).
• 190 miles east of Dallas, TX; 220 miles west of Jackson, MS; 255 miles north of Baton Rouge, LA; 222 miles south of Little Rock, AR.
PROPERTY HIGLIGHTS
• One of the best, most versatile industrial properties on the market in Shreveport
• Shown by Appointment only
• Former use: Shop & Lay Down Yard for Murco & Greywolf Drilling Co’s.
• In Parish of Caddo; and in City of Shreveport
• Zoned: I-2 (Heavy Industrial)
• Flood Zone: “X” protected by levee
• Excellent visibility & access to all passing traffic
• Utilities: Water & Sanitary Sewer by City of Shreveport; Electricity by AEP-SWEPCO; Natural Gas by Centerpoint Energy
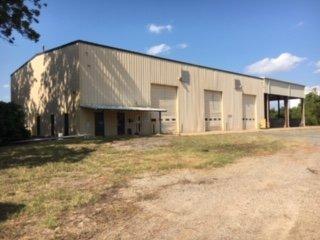
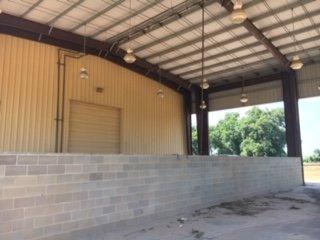
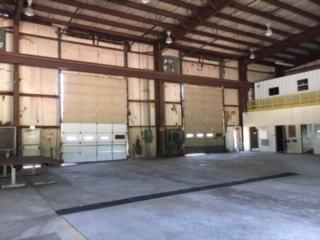
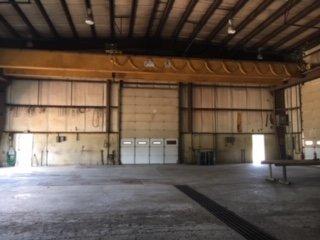
• SHOP BUILDING: 12,620+/- SF Total. See attached Bldg. Floor Plan. Clear span, steel frame on grade level concrete slab with metal exterior walls & roof; 24’+/- eave ht; 20’ wide concrete apron on both sides of building; 15 ton Travel Bridge