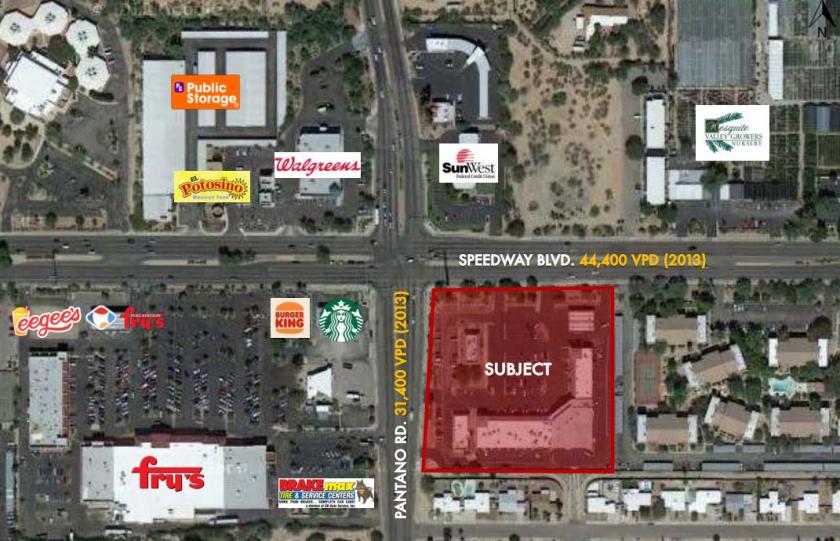
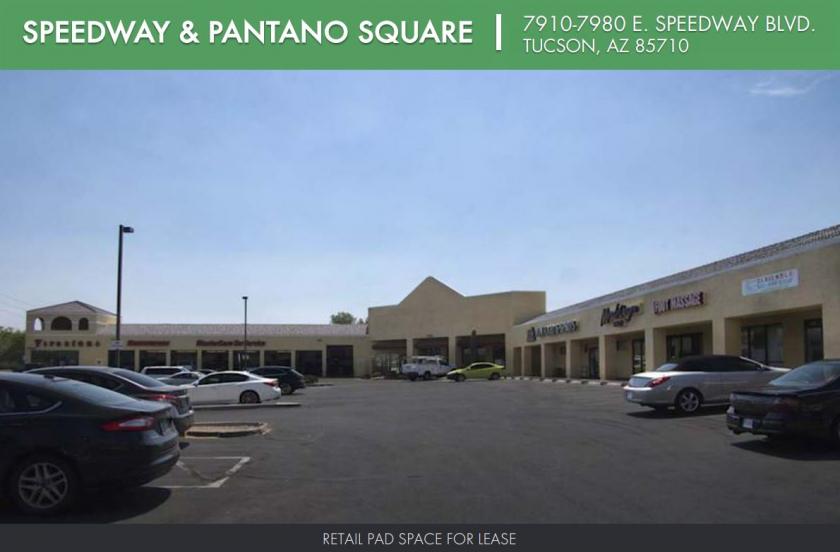
1-Mile | 3-Miles | 5-Miles | ||
---|---|---|---|---|
Total Population | 15,425 | 95,059 | 220,867 | |
Population Median Age | 45 | 43 | 41 | |
Population by Age | 0-9 Yrs | 1525 (9%) | 10038 (10%) | 24418 (11%) |
10-19 Yrs | 1083 (7%) | 9441 (9%) | 23989 (10%) | |
20-29 Yrs | 2634 (17%) | 14473 (15%) | 33146 (15%) | |
30-39 Yrs | 1707 (11%) | 11198 (11%) | 26655 (12%) | |
40-49 Yrs | 1284 (8%) | 9604 (10%) | 23247 (10%) | |
50-59 Yrs | 1687 (10%) | 11208 (11%) | 28412 (12%) | |
60-69 Yrs | 2051 (13%) | 13360 (14%) | 29947 (13%) | |
70+ Yrs | 3454 (22%) | 15737 (16%) | 31053 (14%) | |
Median HH Income | $39,467 | $49,473 | $51,765 | |
Total Household Income | < 24K | 2759 (33%) | 9954 (22%) | 21543 (22%) |
25-49K | 2583 (31%) | 12133 (27%) | 25268 (26%) | |
50-74K | 1326 (15%) | 7956 (18%) | 18207 (18%) | |
75-99K | 849 (10%) | 5646 (12%) | 12042 (12%) | |
100-199K | 664 (8%) | 6439 (14%) | 15347 (15%) | |
200K+ | 108 (1%) | 1603 (3%) | 4084 (4%) | |
Highest Education Level | No Diploma | 929 | 4599 | 11594 |
Diploma or GED | 2860 | 14505 | 33312 | |
Some College | 3148 | 18415 | 41484 | |
Assoc. Degree | 1062 | 6536 | 15011 | |
Bachelors Degree | 2169 | 14384 | 31708 | |
Higher Degree | 1306 | 9447 | 21818 | |
Total Housing Units | 9,331 | 48,914 | 106,933 | |
--Owner-Occupied | 3,473 | 23,935 | 54,568 | |
--Renter-Occupied | 4,816 | 19,797 | 41,922 | |
Owner-Occupied Values | < 100K | 885 | 2890 | 7119 |
100-199K | 1693 | 10902 | 24281 | |
200-299K | 725 | 6721 | 12881 | |
300-399K | 125 | 1891 | 4769 | |
400-499K | 22 | 597 | 2544 | |
500K+ | 22 | 934 | 2975 | |
Total Working Age Population | 13,277 | 79,116 | 182,248 | |
In Work Force | 7,170 | 47,389 | 111,201 | |
Not In Work Force | 6,107 | 31,727 | 71,047 | |
Workforce Employed | 6,624 | 43,749 | 101,456 | |
Workforce Unemployed | 367 | 2,691 | 6,912 | |
Civlian Workforce | 6,991 | 46,441 | 108,368 | |
Military Workforce | 179 | 948 | 2,832 | |
Total Households | 8,289 | 43,732 | 96,490 | |
Family Households | 3,579 | 23,205 | 54,297 | |
Non-Family Households | 4,710 | 20,528 | 42,193 | |
Married Couple | 2,152 | 15,970 | 38,246 | |
Other Family | 1,427 | 7,235 | 16,050 | |
Married w/Child | 588 | 4,756 | 12,219 | |
Single Male w/Child | 157 | 856 | 1,932 | |
Single Female w/Child | 576 | 3,015 | 6,520 |
Population Change Last Two Decades - Plus Projection
2000 | % | 2010 | % | 2020 | % | 2030 | |
---|---|---|---|---|---|---|---|
Arizona | 5,130,632 | +25 | 6,392,017 | +14 | 7,286,100 | +14 | 8,284,900 |
Pima County | 843,746 | +16 | 980,263 | +7 | 1,050,900 | +7 | 1,129,200 |
Total Working Age Population:
Total Households:
Total Working Age Population:
Total Households:
Total Working Age Population:
Total Households: