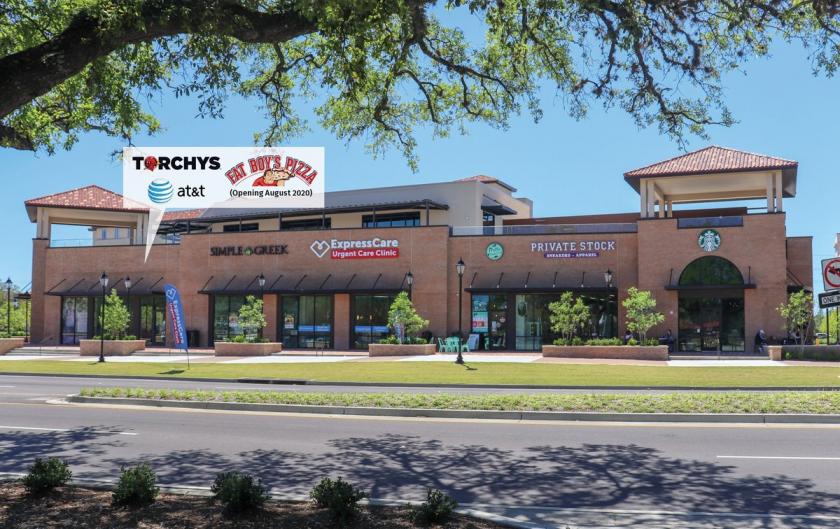
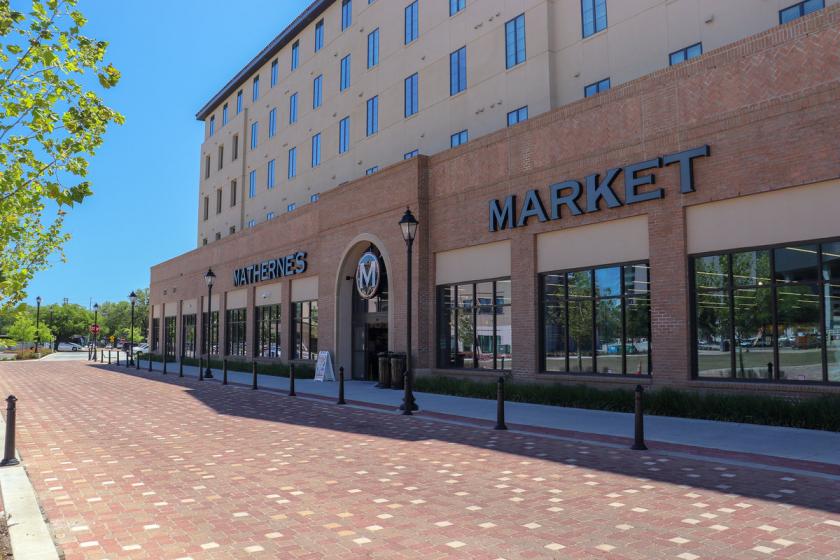
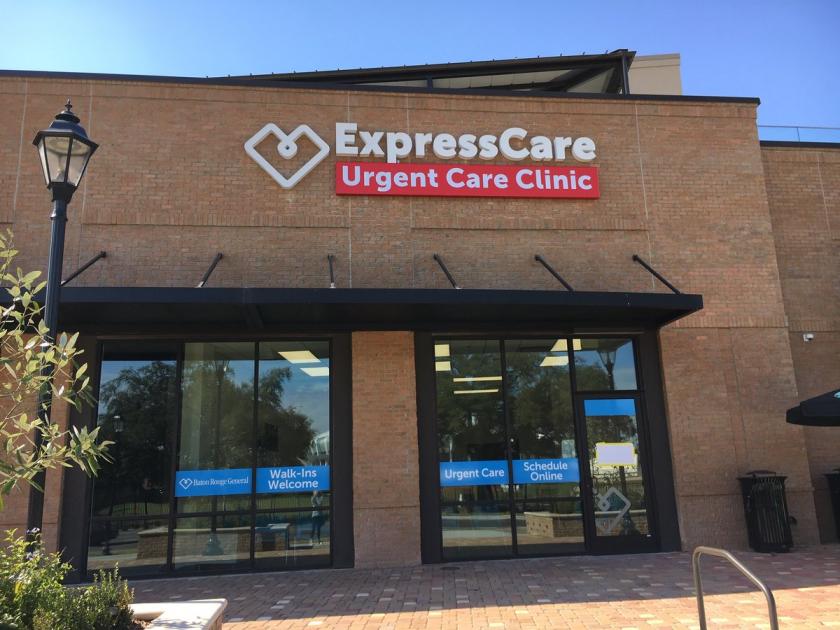
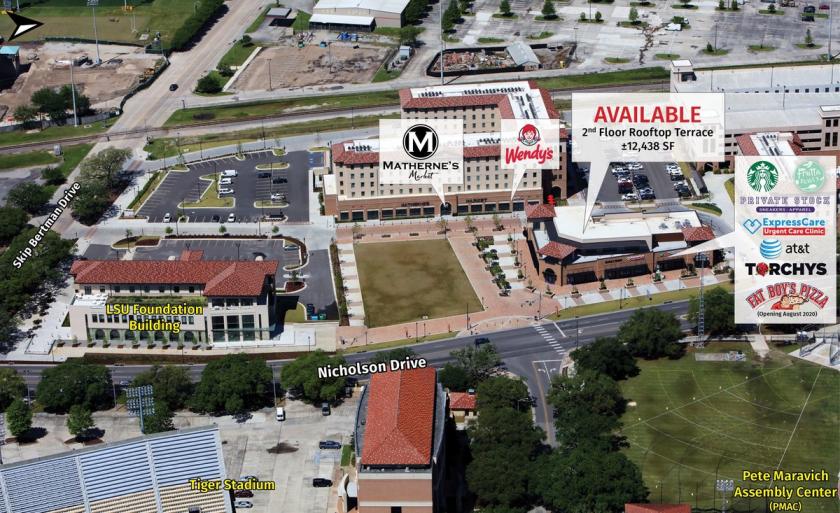
1-Mile | 3-Miles | 5-Miles | ||
---|---|---|---|---|
Total Population | 8,556 | 59,000 | 121,543 | |
Population Median Age | 27 | 34 | 36 | |
Population by Age | 0-9 Yrs | 301 (3%) | 4751 (8%) | 12973 (10%) |
10-19 Yrs | 2920 (34%) | 8999 (15%) | 16058 (13%) | |
20-29 Yrs | 3042 (35%) | 18653 (31%) | 31289 (25%) | |
30-39 Yrs | 789 (9%) | 6742 (11%) | 15287 (12%) | |
40-49 Yrs | 414 (4%) | 5096 (8%) | 11633 (9%) | |
50-59 Yrs | 382 (4%) | 5001 (8%) | 11777 (9%) | |
60-69 Yrs | 405 (4%) | 5780 (9%) | 12637 (10%) | |
70+ Yrs | 305 (3%) | 3978 (6%) | 9889 (8%) | |
Median HH Income | $25,283 | $41,776 | $46,099 | |
Total Household Income | < 24K | 1308 (49%) | 8350 (35%) | 15401 (32%) |
25-49K | 709 (26%) | 4428 (19%) | 9547 (20%) | |
50-74K | 342 (12%) | 3146 (13%) | 6537 (13%) | |
75-99K | 38 (1%) | 1570 (6%) | 3995 (8%) | |
100-199K | 169 (6%) | 3940 (16%) | 8482 (17%) | |
200K+ | 78 (2%) | 1770 (7%) | 3578 (7%) | |
Highest Education Level | No Diploma | 526 | 3335 | 7973 |
Diploma or GED | 670 | 6620 | 17014 | |
Some College | 534 | 5196 | 13217 | |
Assoc. Degree | 82 | 1435 | 3170 | |
Bachelors Degree | 608 | 8527 | 17194 | |
Higher Degree | 745 | 7077 | 13720 | |
Total Housing Units | 4,286 | 30,545 | 59,042 | |
--Owner-Occupied | 500 | 9,638 | 22,508 | |
--Renter-Occupied | 2,143 | 13,565 | 25,033 | |
Owner-Occupied Values | < 100K | 223 | 1293 | 4746 |
100-199K | 95 | 2245 | 5075 | |
200-299K | 112 | 2686 | 5609 | |
300-399K | 9 | 1486 | 2904 | |
400-499K | 5 | 789 | 1550 | |
500K+ | 56 | 1139 | 2623 | |
Total Working Age Population | 8,113 | 52,081 | 102,378 | |
In Work Force | 5,007 | 33,183 | 65,741 | |
Not In Work Force | 3,105 | 18,899 | 36,637 | |
Workforce Employed | 4,201 | 30,347 | 60,299 | |
Workforce Unemployed | 806 | 2,786 | 5,360 | |
Civlian Workforce | 5,007 | 33,133 | 65,659 | |
Military Workforce | 0 | 50 | 82 | |
Total Households | 2,643 | 23,204 | 47,541 | |
Family Households | 727 | 9,477 | 22,970 | |
Non-Family Households | 1,916 | 13,727 | 24,571 | |
Married Couple | 388 | 6,307 | 14,235 | |
Other Family | 339 | 3,170 | 8,735 | |
Married w/Child | 59 | 2,137 | 4,948 | |
Single Male w/Child | 22 | 277 | 582 | |
Single Female w/Child | 104 | 1,117 | 3,401 |
Population Change Last Two Decades - Plus Projection
2000 | % | 2010 | % | 2020 | % | 2030 | |
---|---|---|---|---|---|---|---|
Louisiana | 4,468,976 | +1 | 4,533,372 | +1 | 4,588,310 | +5 | 4,813,420 |
East Baton Rouge Parish | 412,852 | +7 | 440,171 | -3 | 426,380 | -1 | 421,500 |
Iberville Parish | 33,320 | 0 | 33,387 | -17 | 27,830 | -11 | 24,640 |
St. Martin Parish | 48,583 | +7 | 52,160 | +6 | 55,520 | +3 | 57,000 |
West Baton Rouge Parish | 21,601 | +10 | 23,788 | -7 | 22,220 | -5 | 21,070 |
Total Working Age Population:
Total Households:
Total Working Age Population:
Total Households:
Total Working Age Population:
Total Households: