Industrial Properties
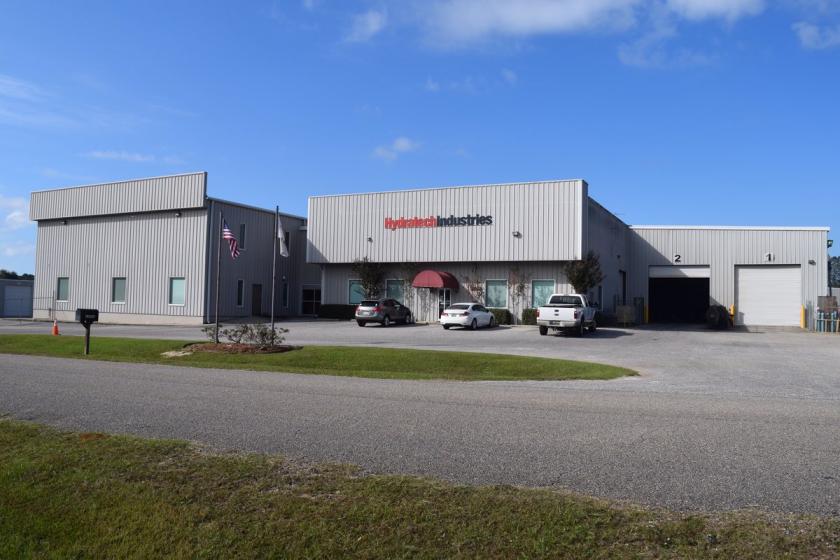
22955 Mcauliffe Drive Robertsdale, AL 36567
22955 Mcauliffe Drive Robertsdale, AL 36567
Details & Description
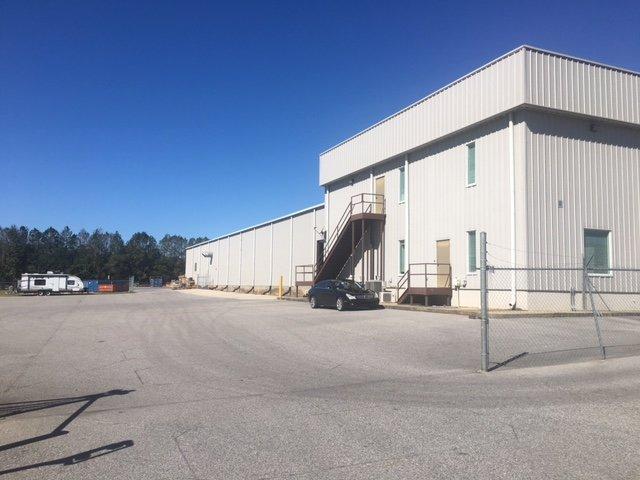
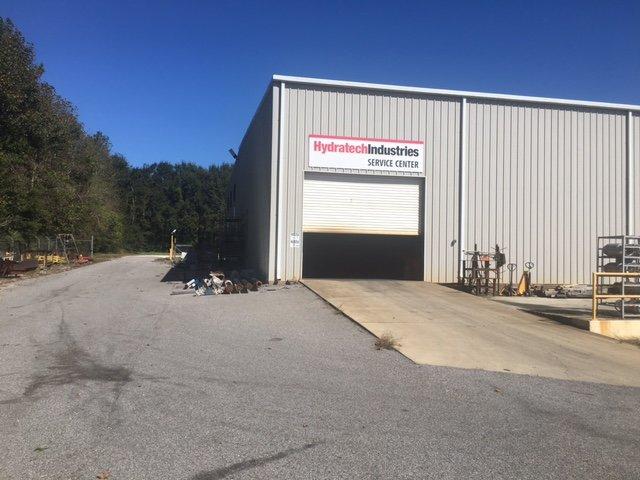
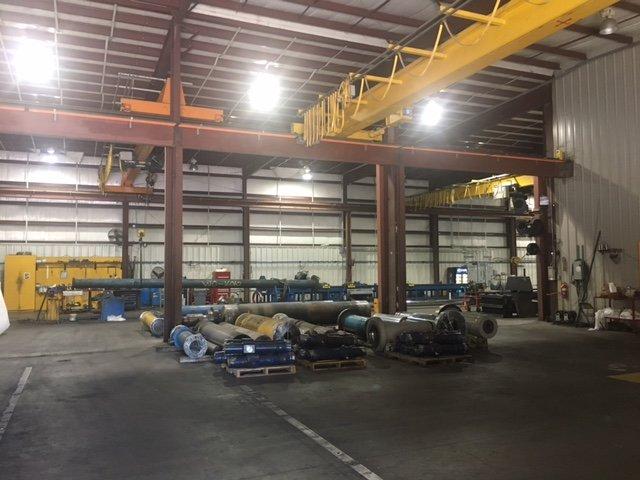
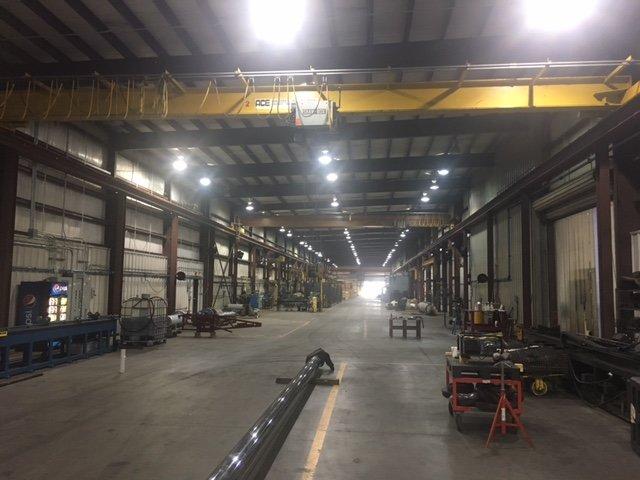
Additional Photos
Listing Agents

Jeff Barnes
O: 251-342-7229
M: 251-975-8222
jbarnes@stirlingprop.com
O: 251-342-7229
M: 251-975-8222
jbarnes@stirlingprop.com
While we strive to provide the most accurate information, all listing information, and demographic data, is provided by third-parties. As such, MyEListing will not be responsible for the accuracy of the information. It is strongly recommended that you verify all information with the listing agent, and any relevant agencies, prior to making any decisions.


