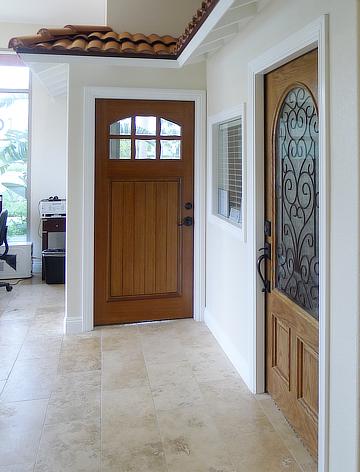
1-Mile | 3-Miles | 5-Miles | ||
---|---|---|---|---|
Total Population | 10,187 | 62,475 | 93,475 | |
Population Median Age | 40 | 41 | 41 | |
Population by Age | 0-9 Yrs | 998 (9%) | 6710 (10%) | 9768 (10%) |
10-19 Yrs | 1179 (11%) | 8119 (12%) | 13018 (13%) | |
20-29 Yrs | 1778 (17%) | 8416 (13%) | 12618 (13%) | |
30-39 Yrs | 1111 (10%) | 7172 (11%) | 9915 (10%) | |
40-49 Yrs | 1375 (13%) | 7656 (12%) | 11638 (12%) | |
50-59 Yrs | 1644 (16%) | 8267 (13%) | 12634 (13%) | |
60-69 Yrs | 1052 (10%) | 7185 (11%) | 10682 (11%) | |
70+ Yrs | 1050 (10%) | 8950 (14%) | 13202 (14%) | |
Median HH Income | $93,751 | $93,189 | $101,818 | |
Total Household Income | < 24K | 536 (14%) | 2660 (11%) | 3429 (10%) |
25-49K | 524 (14%) | 3036 (13%) | 4353 (13%) | |
50-74K | 405 (11%) | 3335 (14%) | 4344 (13%) | |
75-99K | 456 (12%) | 3115 (13%) | 4045 (12%) | |
100-199K | 1113 (30%) | 7468 (33%) | 10908 (33%) | |
200K+ | 580 (16%) | 2981 (13%) | 5814 (17%) | |
Highest Education Level | No Diploma | 858 | 3025 | 3907 |
Diploma or GED | 829 | 6032 | 8737 | |
Some College | 1674 | 11339 | 15936 | |
Assoc. Degree | 884 | 4649 | 6638 | |
Bachelors Degree | 1862 | 11341 | 16812 | |
Higher Degree | 805 | 6453 | 11191 | |
Total Housing Units | 3,760 | 23,489 | 34,301 | |
--Owner-Occupied | 2,297 | 14,686 | 22,659 | |
--Renter-Occupied | 1,317 | 7,908 | 10,235 | |
Owner-Occupied Values | < 100K | 99 | 274 | 446 |
100-199K | 19 | 107 | 327 | |
200-299K | 22 | 360 | 556 | |
300-399K | 179 | 1162 | 1512 | |
400-499K | 359 | 2201 | 2847 | |
500K+ | 1620 | 10581 | 16972 | |
Total Working Age Population | 8,541 | 51,153 | 76,342 | |
In Work Force | 5,662 | 32,321 | 47,576 | |
Not In Work Force | 2,879 | 18,832 | 28,766 | |
Workforce Employed | 5,395 | 30,476 | 44,929 | |
Workforce Unemployed | 239 | 1,412 | 2,172 | |
Civlian Workforce | 5,634 | 31,889 | 47,101 | |
Military Workforce | 28 | 432 | 475 | |
Total Households | 3,614 | 22,594 | 32,894 | |
Family Households | 2,632 | 15,604 | 23,203 | |
Non-Family Households | 982 | 6,990 | 9,691 | |
Married Couple | 2,034 | 12,657 | 19,306 | |
Other Family | 597 | 2,947 | 3,897 | |
Married w/Child | 759 | 4,689 | 7,350 | |
Single Male w/Child | 47 | 350 | 442 | |
Single Female w/Child | 163 | 850 | 1,242 |
Population Change Last Two Decades - Plus Projection
2000 | % | 2010 | % | 2020 | % | 2030 | |
---|---|---|---|---|---|---|---|
California | 33,871,648 | +10 | 37,253,956 | +9 | 40,467,295 | +8 | 43,631,295 |
Los Angeles County | 9,519,338 | +3 | 9,818,605 | +6 | 10,369,367 | +4 | 10,759,850 |
Santa Barbara County | 399,347 | +6 | 423,895 | +8 | 459,787 | +6 | 489,554 |
Ventura County | 753,197 | +9 | 823,318 | +5 | 863,528 | +5 | 909,779 |
Total Working Age Population:
Total Households:
Total Working Age Population:
Total Households:
Total Working Age Population:
Total Households: