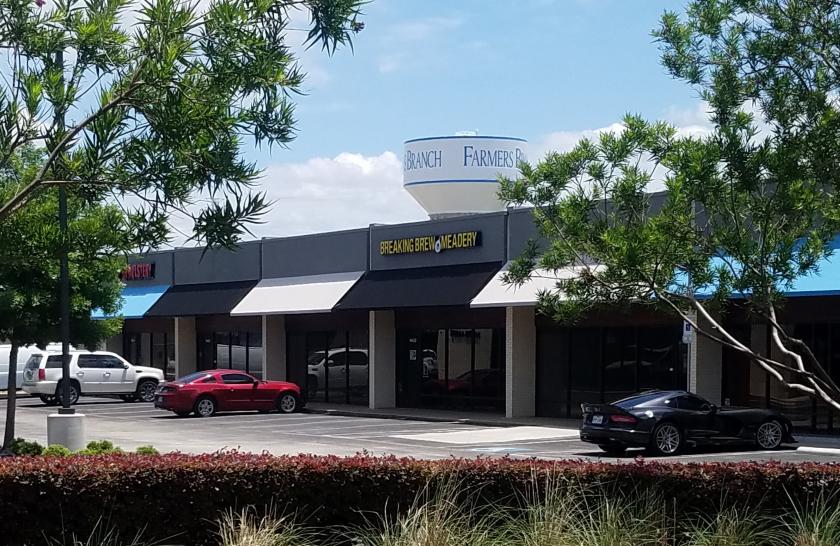
1-Mile | 3-Miles | 5-Miles | ||
---|---|---|---|---|
Total Population | 9,949 | 135,754 | 376,734 | |
Population Median Age | 35 | 38 | 37 | |
Population by Age | 0-9 Yrs | 1327 (13%) | 16383 (12%) | 47794 (12%) |
10-19 Yrs | 758 (7%) | 12818 (9%) | 42821 (11%) | |
20-29 Yrs | 1971 (19%) | 24184 (17%) | 61694 (16%) | |
30-39 Yrs | 2252 (22%) | 23226 (17%) | 62538 (16%) | |
40-49 Yrs | 1239 (12%) | 18277 (13%) | 49788 (13%) | |
50-59 Yrs | 970 (9%) | 16343 (12%) | 46217 (12%) | |
60-69 Yrs | 833 (8%) | 13162 (9%) | 36569 (9%) | |
70+ Yrs | 601 (6%) | 11361 (8%) | 29314 (7%) | |
Median HH Income | $68,923 | $67,743 | $67,936 | |
Total Household Income | < 24K | 574 (11%) | 7789 (12%) | 20072 (12%) |
25-49K | 1116 (22%) | 13344 (22%) | 34979 (22%) | |
50-74K | 971 (19%) | 12251 (20%) | 29785 (19%) | |
75-99K | 798 (16%) | 8380 (13%) | 19360 (12%) | |
100-199K | 1162 (23%) | 12580 (20%) | 32124 (20%) | |
200K+ | 302 (6%) | 5902 (9%) | 18165 (11%) | |
Highest Education Level | No Diploma | 432 | 11574 | 34848 |
Diploma or GED | 1030 | 15738 | 44292 | |
Some College | 1455 | 19672 | 48744 | |
Assoc. Degree | 457 | 5465 | 14252 | |
Bachelors Degree | 2466 | 28790 | 76018 | |
Higher Degree | 1382 | 15574 | 42437 | |
Total Housing Units | 5,599 | 66,628 | 169,354 | |
--Owner-Occupied | 1,121 | 22,197 | 67,979 | |
--Renter-Occupied | 3,801 | 38,050 | 86,505 | |
Owner-Occupied Values | < 100K | 36 | 1425 | 3284 |
100-199K | 150 | 5852 | 16295 | |
200-299K | 237 | 4353 | 14369 | |
300-399K | 538 | 3905 | 11173 | |
400-499K | 144 | 2308 | 7128 | |
500K+ | 16 | 4353 | 15730 | |
Total Working Age Population | 8,175 | 111,676 | 303,133 | |
In Work Force | 6,624 | 85,338 | 226,973 | |
Not In Work Force | 1,551 | 26,338 | 76,160 | |
Workforce Employed | 6,283 | 82,419 | 217,701 | |
Workforce Unemployed | 333 | 2,830 | 9,022 | |
Civlian Workforce | 6,616 | 85,249 | 226,723 | |
Military Workforce | 8 | 88 | 249 | |
Total Households | 4,923 | 60,247 | 154,484 | |
Family Households | 2,233 | 31,795 | 89,759 | |
Non-Family Households | 2,690 | 28,452 | 64,725 | |
Married Couple | 1,452 | 22,355 | 64,949 | |
Other Family | 780 | 9,440 | 24,810 | |
Married w/Child | 464 | 8,561 | 27,582 | |
Single Male w/Child | 157 | 1,328 | 3,259 | |
Single Female w/Child | 405 | 3,607 | 10,263 |
Population Change Last Two Decades - Plus Projection
2000 | % | 2010 | % | 2020 | % | 2030 | |
---|---|---|---|---|---|---|---|
Texas | 20,851,820 | +21 | 25,145,561 | +18 | 29,677,668 | +18 | 34,894,452 |
Collin County | 491,675 | +59 | 782,341 | +33 | 1,039,369 | +34 | 1,391,461 |
Dallas County | 2,218,899 | +7 | 2,368,139 | +15 | 2,734,111 | +14 | 3,106,298 |
Denton County | 432,976 | +53 | 662,614 | +36 | 897,953 | +37 | 1,234,110 |
Total Working Age Population:
Total Households:
Total Working Age Population:
Total Households:
Total Working Age Population:
Total Households: