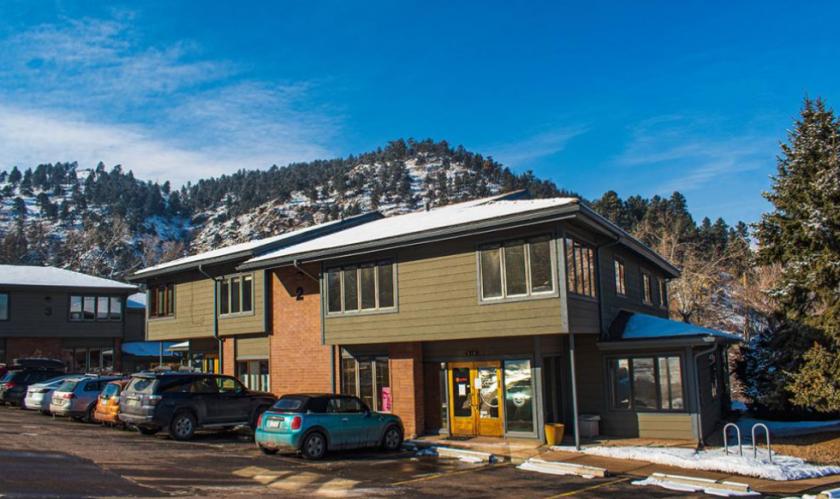
Located at the base of the foothills, Canyon Side Office Park offers unique access to many recreational activities and is a short walk and less than a 5-minute drive to downtown Boulder. With Settler’s Park and Boulder Creek Path directly adjacent, it has easy access to many hiking and multi-use trails.
Suite 6 is a first-floor office space with 2 large private offices, large open office space, and storage
Operable windows
Ample free parking
Designated private bathroom
Access to sauna and showers
Close to Eben Fine park, bike path and trails
Short drive to downtown Boulder and Pearl Street Mall
No part of this information may be copied, reproduced, repurposed, or screen-captured for any commercial purpose without prior written authorization from MyEListing.
While we strive to provide the most accurate information, all listing information, and demographic data, is provided by third-parties. As such, MyEListing will not be responsible for the accuracy of the information. It is strongly recommended that you verify all information with the listing agent, and any relevant agencies, prior to making any decisions.
What is the asking price for 100 Arapahoe Avenue in Boulder?
The asking price for 100 Arapahoe Avenue is $19.50 a SF per Year
What is the building size of this commercial Office property?
The size of this lease property at '.100 Arapahoe Avenue.' is 5833 square feet
What kind of Office is the propery at 100 Arapahoe Avenue?
The property at 100 Arapahoe Avenue Boulder, CO 80302 is listed as a Professional Office property
What is the population within 1 mile of 100 Arapahoe Avenue in Boulder?
The population within 1 mile of 100 Arapahoe Avenue Boulder, CO 80302 is 7,807 people.
Who do I contact for questions about 100 Arapahoe Avenue?
You should contact the listing agent,
Christian Smith, for any details regarding this commercial listing.