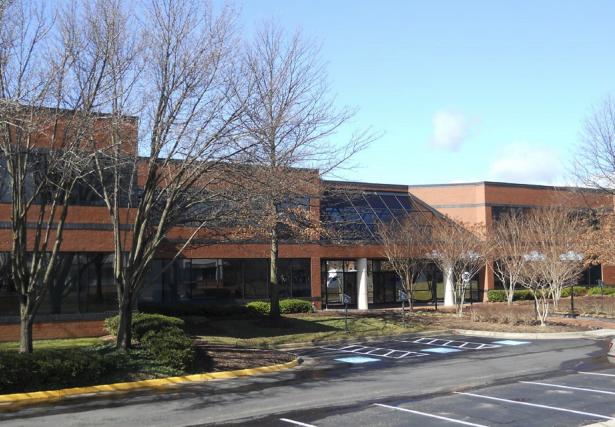
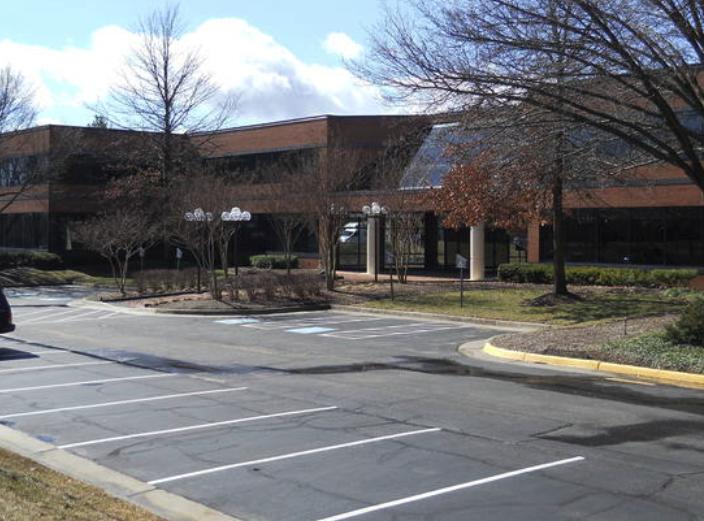
1-Mile | 3-Miles | 5-Miles | ||
---|---|---|---|---|
Total Population | 5,309 | 59,100 | 123,022 | |
Population Median Age | 34 | 34 | 35 | |
Population by Age | 0-9 Yrs | 848 (15%) | 8586 (14%) | 17233 (14%) |
10-19 Yrs | 815 (15%) | 9456 (16%) | 20704 (16%) | |
20-29 Yrs | 556 (10%) | 7022 (11%) | 12771 (10%) | |
30-39 Yrs | 767 (14%) | 8924 (15%) | 16758 (13%) | |
40-49 Yrs | 1099 (20%) | 10421 (17%) | 21555 (17%) | |
50-59 Yrs | 736 (13%) | 8188 (13%) | 18039 (14%) | |
60-69 Yrs | 343 (6%) | 3977 (6%) | 8785 (7%) | |
70+ Yrs | 146 (2%) | 2527 (4%) | 7177 (5%) | |
Median HH Income | $144,216 | $126,649 | $144,401 | |
Total Household Income | < 24K | 53 (3%) | 1115 (5%) | 1892 (4%) |
25-49K | 82 (4%) | 2136 (10%) | 3437 (8%) | |
50-74K | 139 (7%) | 2317 (11%) | 4334 (10%) | |
75-99K | 170 (9%) | 2248 (11%) | 4002 (9%) | |
100-199K | 819 (46%) | 7124 (36%) | 14253 (35%) | |
200K+ | 485 (27%) | 4718 (24%) | 12644 (31%) | |
Highest Education Level | No Diploma | 59 | 2775 | 4192 |
Diploma or GED | 389 | 5477 | 9705 | |
Some College | 447 | 5191 | 10695 | |
Assoc. Degree | 261 | 2413 | 4818 | |
Bachelors Degree | 1386 | 13271 | 28700 | |
Higher Degree | 875 | 8440 | 20369 | |
Total Housing Units | 1,748 | 20,257 | 41,889 | |
--Owner-Occupied | 1,616 | 14,775 | 31,947 | |
--Renter-Occupied | 131 | 4,883 | 8,614 | |
Owner-Occupied Values | < 100K | 33 | 254 | 505 |
100-199K | 74 | 660 | 1143 | |
200-299K | 162 | 1734 | 2821 | |
300-399K | 411 | 3152 | 5584 | |
400-499K | 351 | 2864 | 5155 | |
500K+ | 585 | 6111 | 16739 | |
Total Working Age Population | 4,072 | 44,498 | 92,501 | |
In Work Force | 3,058 | 34,687 | 69,456 | |
Not In Work Force | 1,013 | 9,811 | 23,045 | |
Workforce Employed | 2,928 | 33,167 | 66,954 | |
Workforce Unemployed | 69 | 1,223 | 2,047 | |
Civlian Workforce | 2,997 | 34,390 | 69,001 | |
Military Workforce | 62 | 297 | 456 | |
Total Households | 1,748 | 19,658 | 40,561 | |
Family Households | 1,366 | 14,750 | 31,459 | |
Non-Family Households | 382 | 4,908 | 9,103 | |
Married Couple | 1,266 | 12,529 | 27,142 | |
Other Family | 100 | 2,221 | 4,316 | |
Married w/Child | 715 | 7,060 | 15,520 | |
Single Male w/Child | 35 | 468 | 724 | |
Single Female w/Child | 62 | 919 | 1,865 |
Population Change Last Two Decades - Plus Projection
2000 | % | 2010 | % | 2020 | % | 2030 | |
---|---|---|---|---|---|---|---|
Maryland | 5,296,486 | +9 | 5,773,552 | +6 | 6,141,900 | +6 | 6,518,750 |
Montgomery County | 873,341 | +11 | 971,777 | +8 | 1,052,050 | +7 | 1,128,800 |
Virginia | 7,078,515 | +13 | 8,001,024 | +8 | 8,655,021 | +8 | 9,331,666 |
Fairfax County | 969,749 | +12 | 1,081,726 | +7 | 1,162,504 | +7 | 1,244,025 |
Fauquier County | 55,139 | +18 | 65,203 | +9 | 71,395 | +10 | 78,698 |
Loudoun County | 169,599 | +84 | 312,311 | +38 | 430,584 | +29 | 554,808 |
Total Working Age Population:
Total Households:
Total Working Age Population:
Total Households:
Total Working Age Population:
Total Households: