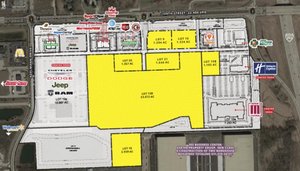
1-Mile | 3-Miles | 5-Miles | ||
---|---|---|---|---|
Total Population | 3,863 | 19,881 | 29,175 | |
Population Median Age | 46 | 41 | 41 | |
Population by Age | 0-9 Yrs | 444 (11%) | 2561 (12%) | 3556 (12%) |
10-19 Yrs | 426 (11%) | 2408 (12%) | 3584 (12%) | |
20-29 Yrs | 287 (7%) | 2292 (11%) | 3435 (11%) | |
30-39 Yrs | 342 (8%) | 2474 (12%) | 3550 (12%) | |
40-49 Yrs | 416 (10%) | 2132 (10%) | 3227 (11%) | |
50-59 Yrs | 702 (18%) | 2976 (14%) | 4322 (14%) | |
60-69 Yrs | 266 (6%) | 1896 (9%) | 2989 (10%) | |
70+ Yrs | 979 (25%) | 3142 (15%) | 4512 (15%) | |
Median HH Income | $56,529 | $50,940 | $52,251 | |
Total Household Income | < 24K | 372 (22%) | 1999 (23%) | 2839 (23%) |
25-49K | 389 (23%) | 2129 (25%) | 3087 (25%) | |
50-74K | 287 (17%) | 1701 (20%) | 2417 (19%) | |
75-99K | 243 (14%) | 998 (11%) | 1466 (11%) | |
100-199K | 263 (15%) | 1313 (15%) | 2070 (16%) | |
200K+ | 98 (5%) | 248 (2%) | 420 (3%) | |
Highest Education Level | No Diploma | 154 | 1554 | 2244 |
Diploma or GED | 898 | 4548 | 6722 | |
Some College | 681 | 3371 | 4950 | |
Assoc. Degree | 463 | 1568 | 2320 | |
Bachelors Degree | 460 | 1972 | 2819 | |
Higher Degree | 204 | 800 | 1278 | |
Total Housing Units | 1,724 | 9,380 | 13,706 | |
--Owner-Occupied | 1,169 | 5,467 | 8,286 | |
--Renter-Occupied | 484 | 2,919 | 4,012 | |
Owner-Occupied Values | < 100K | 264 | 2353 | 3578 |
100-199K | 600 | 2290 | 3330 | |
200-299K | 159 | 445 | 858 | |
300-399K | 88 | 231 | 317 | |
400-499K | 24 | 79 | 115 | |
500K+ | 34 | 69 | 88 | |
Total Working Age Population | 3,227 | 15,883 | 23,461 | |
In Work Force | 1,855 | 9,997 | 14,714 | |
Not In Work Force | 1,371 | 5,886 | 8,747 | |
Workforce Employed | 1,800 | 9,447 | 13,986 | |
Workforce Unemployed | 56 | 549 | 722 | |
Civlian Workforce | 1,855 | 9,996 | 14,709 | |
Military Workforce | 0 | 2 | 5 | |
Total Households | 1,653 | 8,386 | 12,299 | |
Family Households | 942 | 4,866 | 7,427 | |
Non-Family Households | 711 | 3,520 | 4,871 | |
Married Couple | 754 | 3,466 | 5,369 | |
Other Family | 188 | 1,400 | 2,058 | |
Married w/Child | 280 | 1,239 | 1,820 | |
Single Male w/Child | 16 | 175 | 279 | |
Single Female w/Child | 92 | 652 | 991 |
Population Change Last Two Decades - Plus Projection
2000 | % | 2010 | % | 2020 | % | 2030 | |
---|---|---|---|---|---|---|---|
Illinois | 12,419,293 | +3 | 12,830,632 | +12 | 14,316,487 | +6 | 15,138,849 |
Bureau County | 35,503 | -1 | 34,978 | +10 | 38,631 | +6 | 40,820 |
LaSalle County | 111,509 | +2 | 113,924 | +15 | 131,155 | +8 | 141,615 |
Putnam County | 6,086 | -1 | 6,006 | +9 | 6,526 | +4 | 6,758 |
Total Working Age Population:
Total Households:
Total Working Age Population:
Total Households:
Total Working Age Population:
Total Households: