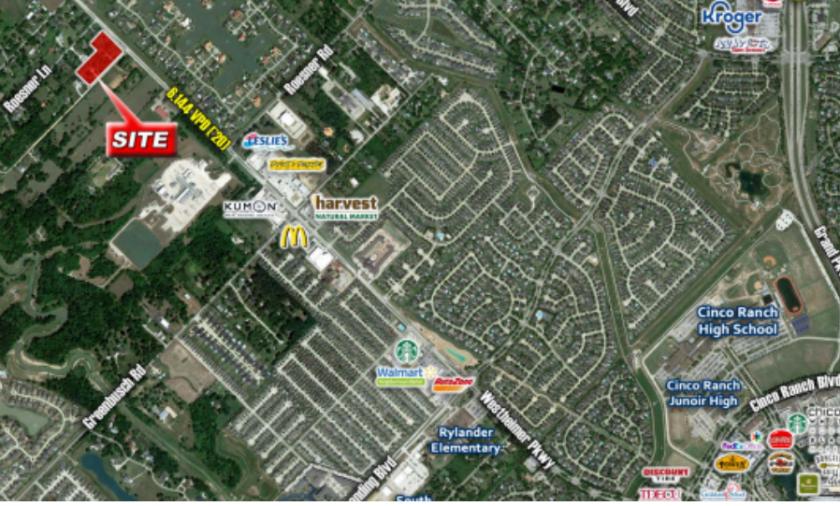
1-Mile | 3-Miles | 5-Miles | ||
---|---|---|---|---|
Total Population | 6,351 | 100,983 | 224,304 | |
Population Median Age | 34 | 34 | 34 | |
Population by Age | 0-9 Yrs | 934 (14%) | 15922 (15%) | 35531 (15%) |
10-19 Yrs | 1323 (20%) | 17937 (17%) | 38100 (16%) | |
20-29 Yrs | 346 (5%) | 9079 (8%) | 21616 (9%) | |
30-39 Yrs | 797 (12%) | 14888 (14%) | 33109 (14%) | |
40-49 Yrs | 1462 (23%) | 18561 (18%) | 39182 (17%) | |
50-59 Yrs | 837 (13%) | 11264 (11%) | 26408 (11%) | |
60-69 Yrs | 364 (5%) | 7795 (7%) | 17869 (7%) | |
70+ Yrs | 288 (4%) | 5538 (5%) | 12490 (5%) | |
Median HH Income | $155,272 | $120,506 | $112,964 | |
Total Household Income | < 24K | 108 (5%) | 2027 (6%) | 5094 (7%) |
25-49K | 148 (7%) | 3364 (10%) | 7972 (11%) | |
50-74K | 131 (6%) | 4120 (12%) | 9384 (13%) | |
75-99K | 154 (7%) | 3477 (10%) | 8735 (12%) | |
100-199K | 870 (42%) | 11751 (36%) | 25757 (36%) | |
200K+ | 625 (30%) | 7520 (23%) | 14243 (20%) | |
Highest Education Level | No Diploma | 93 | 2740 | 7502 |
Diploma or GED | 361 | 7695 | 19349 | |
Some College | 878 | 12573 | 28086 | |
Assoc. Degree | 517 | 4702 | 11209 | |
Bachelors Degree | 1263 | 20202 | 43738 | |
Higher Degree | 807 | 14947 | 30088 | |
Total Housing Units | 2,108 | 33,829 | 75,020 | |
--Owner-Occupied | 1,734 | 23,528 | 52,784 | |
--Renter-Occupied | 302 | 8,733 | 18,401 | |
Owner-Occupied Values | < 100K | 1 | 366 | 1567 |
100-199K | 23 | 2789 | 10095 | |
200-299K | 507 | 7441 | 16354 | |
300-399K | 660 | 6640 | 12561 | |
400-499K | 347 | 3402 | 6303 | |
500K+ | 196 | 2889 | 5903 | |
Total Working Age Population | 4,412 | 72,765 | 163,106 | |
In Work Force | 3,106 | 49,296 | 111,719 | |
Not In Work Force | 1,307 | 23,469 | 51,387 | |
Workforce Employed | 3,025 | 46,586 | 105,416 | |
Workforce Unemployed | 80 | 2,676 | 6,203 | |
Civlian Workforce | 3,106 | 49,262 | 111,618 | |
Military Workforce | 0 | 34 | 101 | |
Total Households | 2,036 | 32,261 | 71,185 | |
Family Households | 1,804 | 26,642 | 58,995 | |
Non-Family Households | 232 | 5,619 | 12,190 | |
Married Couple | 1,663 | 23,103 | 49,657 | |
Other Family | 140 | 3,539 | 9,338 | |
Married w/Child | 1,094 | 14,297 | 29,355 | |
Single Male w/Child | 52 | 535 | 1,326 | |
Single Female w/Child | 62 | 1,522 | 4,045 |
Population Change Last Two Decades - Plus Projection
2000 | % | 2010 | % | 2020 | % | 2030 | |
---|---|---|---|---|---|---|---|
Texas | 20,851,820 | +21 | 25,145,561 | +18 | 29,677,668 | +18 | 34,894,452 |
Fort Bend County | 354,452 | +65 | 585,375 | +44 | 840,383 | +43 | 1,203,029 |
Harris County | 3,400,578 | +20 | 4,092,459 | +22 | 4,978,845 | +19 | 5,924,750 |
Waller County | 32,663 | +32 | 43,205 | +17 | 50,731 | +16 | 59,021 |
Total Working Age Population:
Total Households:
Total Working Age Population:
Total Households:
Total Working Age Population:
Total Households: