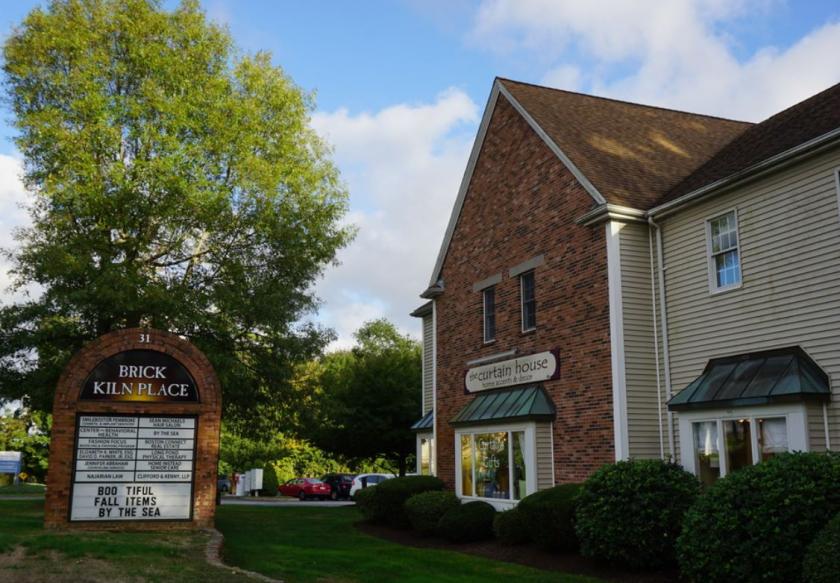
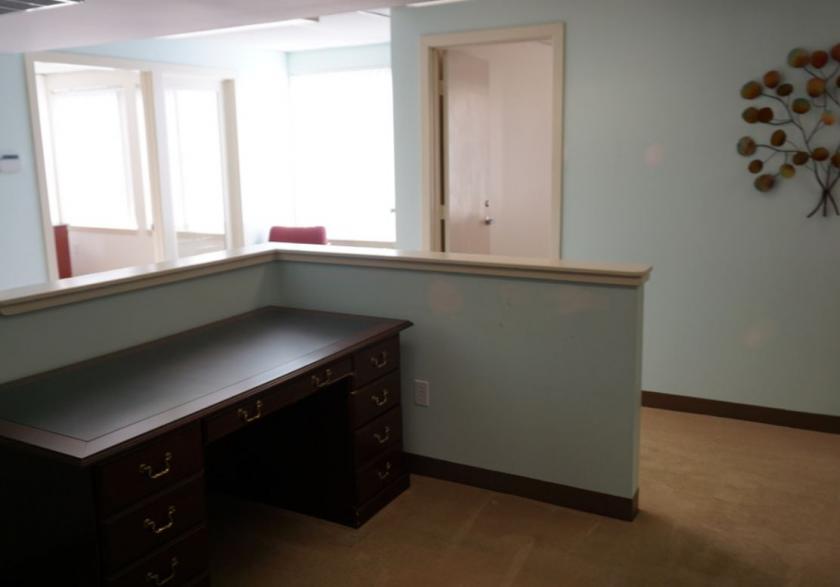
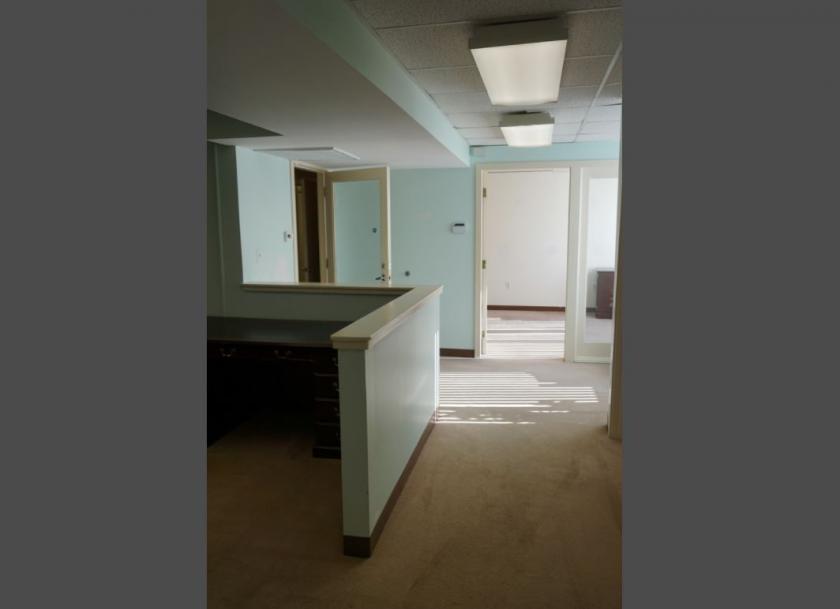
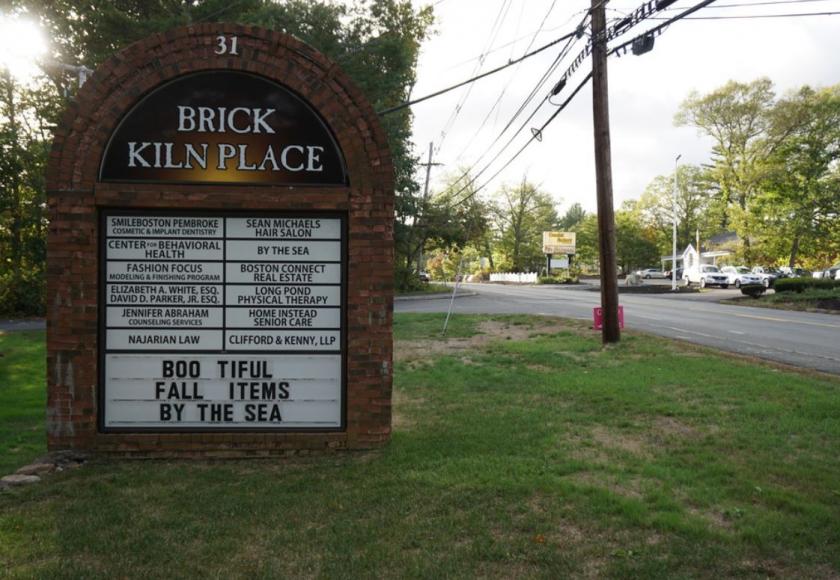
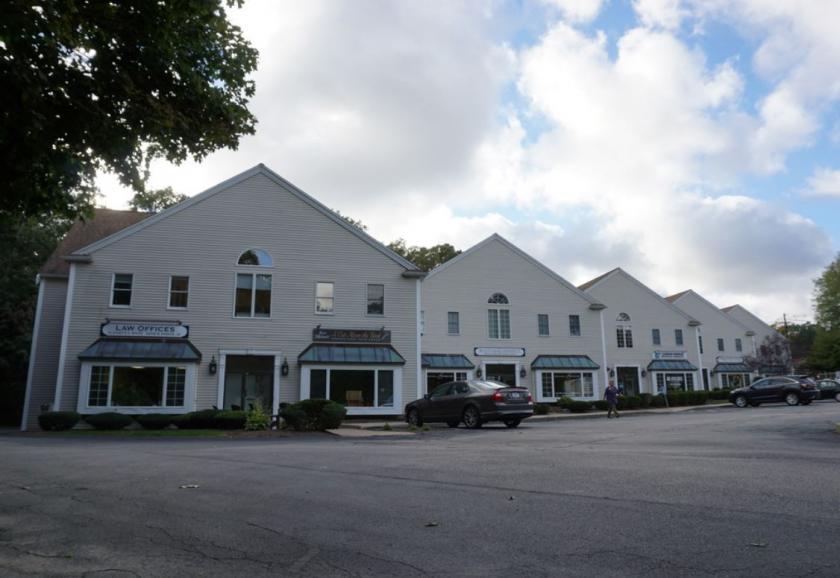
1-Mile | 3-Miles | 5-Miles | ||
---|---|---|---|---|
Total Population | 1,710 | 21,282 | 59,044 | |
Population Median Age | 42 | 40 | 40 | |
Population by Age | 0-9 Yrs | 135 (7%) | 2294 (10%) | 6736 (11%) |
10-19 Yrs | 331 (19%) | 3377 (15%) | 8722 (14%) | |
20-29 Yrs | 109 (6%) | 2049 (9%) | 6020 (10%) | |
30-39 Yrs | 172 (10%) | 2268 (10%) | 5810 (9%) | |
40-49 Yrs | 220 (12%) | 3033 (14%) | 8570 (14%) | |
50-59 Yrs | 325 (19%) | 3703 (17%) | 10165 (17%) | |
60-69 Yrs | 211 (12%) | 2202 (10%) | 6632 (11%) | |
70+ Yrs | 206 (12%) | 2357 (11%) | 6390 (10%) | |
Median HH Income | $100,361 | $116,992 | $118,086 | |
Total Household Income | < 24K | 107 (15%) | 655 (8%) | 1788 (8%) |
25-49K | 107 (15%) | 909 (12%) | 2382 (11%) | |
50-74K | 47 (7%) | 872 (11%) | 2333 (11%) | |
75-99K | 73 (10%) | 862 (11%) | 2235 (10%) | |
100-199K | 218 (32%) | 2688 (35%) | 7614 (36%) | |
200K+ | 118 (17%) | 1589 (20%) | 4403 (21%) | |
Highest Education Level | No Diploma | 25 | 467 | 1382 |
Diploma or GED | 385 | 3658 | 9399 | |
Some College | 174 | 2123 | 6363 | |
Assoc. Degree | 79 | 1348 | 3770 | |
Bachelors Degree | 321 | 4405 | 12171 | |
Higher Degree | 213 | 2511 | 7112 | |
Total Housing Units | 700 | 7,802 | 21,626 | |
--Owner-Occupied | 476 | 6,165 | 18,024 | |
--Renter-Occupied | 195 | 1,410 | 2,731 | |
Owner-Occupied Values | < 100K | 7 | 96 | 285 |
100-199K | 27 | 173 | 482 | |
200-299K | 71 | 491 | 1667 | |
300-399K | 64 | 1118 | 3845 | |
400-499K | 118 | 1399 | 3857 | |
500K+ | 189 | 2889 | 7887 | |
Total Working Age Population | 1,384 | 16,987 | 47,170 | |
In Work Force | 856 | 11,785 | 33,080 | |
Not In Work Force | 529 | 5,203 | 14,090 | |
Workforce Employed | 827 | 11,320 | 31,747 | |
Workforce Unemployed | 27 | 451 | 1,309 | |
Civlian Workforce | 854 | 11,771 | 33,056 | |
Military Workforce | 1 | 14 | 24 | |
Total Households | 670 | 7,574 | 20,755 | |
Family Households | 425 | 5,482 | 15,484 | |
Non-Family Households | 245 | 2,092 | 5,271 | |
Married Couple | 349 | 4,579 | 13,216 | |
Other Family | 76 | 903 | 2,268 | |
Married w/Child | 169 | 2,281 | 6,177 | |
Single Male w/Child | 6 | 54 | 165 | |
Single Female w/Child | 16 | 194 | 570 |
Population Change Last Two Decades - Plus Projection
2000 | % | 2010 | % | 2020 | % | 2030 | |
---|---|---|---|---|---|---|---|
Massachusetts | 6,349,097 | +3 | 6,547,629 | +6 | 6,933,887 | +4 | 7,225,472 |
Barnstable County | 222,230 | -3 | 215,888 | -2 | 210,930 | -5 | 199,466 |
Bristol County | 534,678 | +3 | 548,285 | +2 | 561,478 | +1 | 567,277 |
Norfolk County | 650,308 | +3 | 670,850 | +7 | 718,394 | +7 | 765,912 |
Plymouth County | 472,822 | +5 | 494,919 | +5 | 518,508 | +3 | 534,464 |
Total Working Age Population:
Total Households:
Total Working Age Population:
Total Households:
Total Working Age Population:
Total Households: