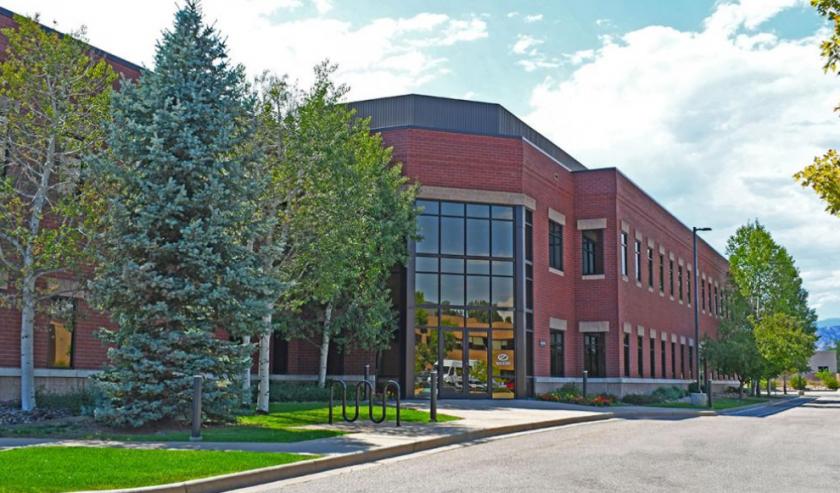
1-Mile | 3-Miles | 5-Miles | ||
---|---|---|---|---|
Total Population | 3,892 | 75,053 | 137,274 | |
Population Median Age | 40 | 34 | 36 | |
Population by Age | 0-9 Yrs | 282 (7%) | 4071 (5%) | 9748 (7%) |
10-19 Yrs | 483 (12%) | 12184 (16%) | 20157 (14%) | |
20-29 Yrs | 611 (15%) | 25578 (34%) | 36710 (26%) | |
30-39 Yrs | 634 (16%) | 9562 (12%) | 16382 (11%) | |
40-49 Yrs | 529 (13%) | 6562 (8%) | 14669 (10%) | |
50-59 Yrs | 571 (14%) | 6393 (8%) | 14945 (10%) | |
60-69 Yrs | 476 (12%) | 5599 (7%) | 13904 (10%) | |
70+ Yrs | 305 (7%) | 5104 (6%) | 10759 (7%) | |
Median HH Income | $103,583 | $62,092 | $76,840 | |
Total Household Income | < 24K | 211 (13%) | 6852 (23%) | 10105 (18%) |
25-49K | 221 (14%) | 5501 (18%) | 8962 (16%) | |
50-74K | 203 (12%) | 4538 (15%) | 7845 (14%) | |
75-99K | 122 (7%) | 2938 (9%) | 5412 (9%) | |
100-199K | 487 (30%) | 6147 (20%) | 13286 (24%) | |
200K+ | 334 (21%) | 3433 (11%) | 9011 (16%) | |
Highest Education Level | No Diploma | 213 | 1442 | 2299 |
Diploma or GED | 319 | 3002 | 5743 | |
Some College | 218 | 5339 | 9711 | |
Assoc. Degree | 100 | 1785 | 3420 | |
Bachelors Degree | 1003 | 15643 | 30727 | |
Higher Degree | 1025 | 15031 | 31567 | |
Total Housing Units | 1,701 | 31,552 | 58,072 | |
--Owner-Occupied | 1,101 | 13,124 | 30,140 | |
--Renter-Occupied | 476 | 16,284 | 24,482 | |
Owner-Occupied Values | < 100K | 228 | 1006 | 1620 |
100-199K | 35 | 665 | 1204 | |
200-299K | 27 | 942 | 1375 | |
300-399K | 28 | 1277 | 2147 | |
400-499K | 73 | 1205 | 2515 | |
500K+ | 711 | 8029 | 21278 | |
Total Working Age Population | 3,322 | 68,274 | 120,377 | |
In Work Force | 2,298 | 44,634 | 80,139 | |
Not In Work Force | 1,024 | 23,641 | 40,238 | |
Workforce Employed | 2,220 | 42,812 | 76,607 | |
Workforce Unemployed | 78 | 1,804 | 3,514 | |
Civlian Workforce | 2,298 | 44,616 | 80,121 | |
Military Workforce | 0 | 18 | 18 | |
Total Households | 1,577 | 29,408 | 54,621 | |
Family Households | 870 | 11,080 | 25,736 | |
Non-Family Households | 707 | 18,328 | 28,885 | |
Married Couple | 688 | 8,809 | 21,393 | |
Other Family | 182 | 2,271 | 4,343 | |
Married w/Child | 281 | 3,477 | 8,690 | |
Single Male w/Child | 42 | 387 | 707 | |
Single Female w/Child | 86 | 757 | 1,708 |
Population Change Last Two Decades - Plus Projection
2000 | % | 2010 | % | 2020 | % | 2030 | |
---|---|---|---|---|---|---|---|
Colorado | 4,301,261 | +17 | 5,029,196 | +16 | 5,838,181 | +15 | 6,733,658 |
Boulder County | 291,288 | +1 | 294,567 | +13 | 332,134 | +12 | 370,618 |
Broomfield County | 0 | 55,889 | +32 | 73,822 | +28 | 94,282 |
Total Working Age Population:
Total Households:
Total Working Age Population:
Total Households:
Total Working Age Population:
Total Households: