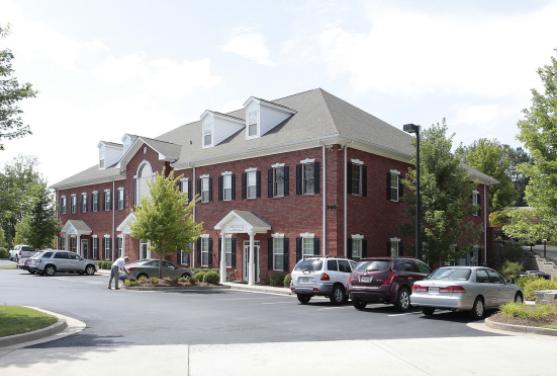
1-Mile | 3-Miles | 5-Miles | ||
---|---|---|---|---|
Total Population | 8,757 | 59,696 | 161,767 | |
Population Median Age | 38 | 38 | 38 | |
Population by Age | 0-9 Yrs | 1112 (12%) | 8042 (13%) | 19906 (12%) |
10-19 Yrs | 1072 (12%) | 7750 (12%) | 22898 (14%) | |
20-29 Yrs | 1080 (12%) | 6895 (11%) | 19097 (11%) | |
30-39 Yrs | 1446 (16%) | 8697 (14%) | 21418 (13%) | |
40-49 Yrs | 1312 (14%) | 8970 (15%) | 23754 (14%) | |
50-59 Yrs | 1012 (11%) | 7931 (13%) | 23265 (14%) | |
60-69 Yrs | 955 (10%) | 6501 (10%) | 18244 (11%) | |
70+ Yrs | 768 (8%) | 4911 (8%) | 13183 (8%) | |
Median HH Income | $63,265 | $77,384 | $86,652 | |
Total Household Income | < 24K | 510 (14%) | 2783 (12%) | 6075 (10%) |
25-49K | 729 (21%) | 3944 (17%) | 9072 (15%) | |
50-74K | 785 (22%) | 4226 (18%) | 10000 (17%) | |
75-99K | 565 (16%) | 3328 (14%) | 8490 (14%) | |
100-199K | 662 (19%) | 6453 (28%) | 18788 (32%) | |
200K+ | 218 (6%) | 1808 (8%) | 5784 (9%) | |
Highest Education Level | No Diploma | 379 | 2403 | 5488 |
Diploma or GED | 1101 | 7412 | 19935 | |
Some College | 1754 | 9656 | 25244 | |
Assoc. Degree | 634 | 3243 | 8345 | |
Bachelors Degree | 1556 | 12754 | 34925 | |
Higher Degree | 768 | 5408 | 16056 | |
Total Housing Units | 3,680 | 23,804 | 60,695 | |
--Owner-Occupied | 2,093 | 16,436 | 45,350 | |
--Renter-Occupied | 1,376 | 6,106 | 12,860 | |
Owner-Occupied Values | < 100K | 93 | 672 | 1377 |
100-199K | 768 | 5670 | 12958 | |
200-299K | 740 | 5874 | 15532 | |
300-399K | 213 | 2094 | 7458 | |
400-499K | 121 | 1067 | 4073 | |
500K+ | 157 | 1059 | 3952 | |
Total Working Age Population | 6,928 | 46,862 | 127,188 | |
In Work Force | 4,898 | 33,266 | 89,709 | |
Not In Work Force | 2,031 | 13,596 | 37,480 | |
Workforce Employed | 4,693 | 31,905 | 86,269 | |
Workforce Unemployed | 204 | 1,321 | 3,317 | |
Civlian Workforce | 4,897 | 33,227 | 89,586 | |
Military Workforce | 1 | 40 | 122 | |
Total Households | 3,469 | 22,542 | 58,210 | |
Family Households | 2,382 | 16,051 | 43,644 | |
Non-Family Households | 1,087 | 6,491 | 14,566 | |
Married Couple | 1,864 | 12,729 | 35,547 | |
Other Family | 518 | 3,322 | 8,097 | |
Married w/Child | 815 | 5,509 | 15,768 | |
Single Male w/Child | 53 | 487 | 1,116 | |
Single Female w/Child | 239 | 1,486 | 3,104 |
Population Change Last Two Decades - Plus Projection
2000 | % | 2010 | % | 2020 | % | 2030 | |
---|---|---|---|---|---|---|---|
Georgia | 8,186,453 | +18 | 9,687,653 | +12 | 10,833,472 | +13 | 12,292,423 |
Cherokee County | 141,903 | +51 | 214,346 | +24 | 266,617 | +20 | 320,849 |
Cobb County | 607,751 | +13 | 688,078 | +15 | 790,588 | +19 | 938,747 |
Fulton County | 816,006 | +13 | 920,581 | +19 | 1,099,181 | +18 | 1,300,861 |
Total Working Age Population:
Total Households:
Total Working Age Population:
Total Households:
Total Working Age Population:
Total Households: