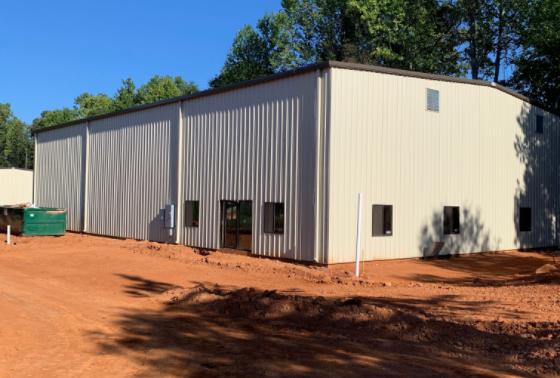
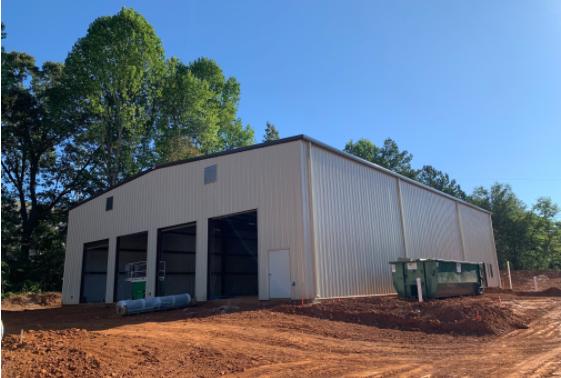
1-Mile | 3-Miles | 5-Miles | ||
---|---|---|---|---|
Total Population | 6,442 | 47,880 | 171,405 | |
Population Median Age | 35 | 37 | 37 | |
Population by Age | 0-9 Yrs | 684 (10%) | 6300 (13%) | 21702 (12%) |
10-19 Yrs | 516 (8%) | 4901 (10%) | 23060 (13%) | |
20-29 Yrs | 1782 (27%) | 8269 (17%) | 28122 (16%) | |
30-39 Yrs | 1061 (16%) | 7533 (15%) | 24781 (14%) | |
40-49 Yrs | 870 (13%) | 5899 (12%) | 22279 (12%) | |
50-59 Yrs | 755 (11%) | 6014 (12%) | 20974 (12%) | |
60-69 Yrs | 418 (6%) | 4460 (9%) | 16234 (9%) | |
70+ Yrs | 358 (5%) | 4502 (9%) | 14254 (8%) | |
Median HH Income | $71,100 | $72,509 | $70,590 | |
Total Household Income | < 24K | 307 (10%) | 2707 (13%) | 9069 (14%) |
25-49K | 825 (26%) | 4409 (21%) | 13822 (21%) | |
50-74K | 491 (16%) | 3316 (16%) | 11221 (17%) | |
75-99K | 799 (26%) | 3447 (17%) | 9578 (14%) | |
100-199K | 518 (16%) | 4675 (23%) | 15802 (24%) | |
200K+ | 115 (3%) | 1648 (8%) | 4995 (7%) | |
Highest Education Level | No Diploma | 162 | 2327 | 10406 |
Diploma or GED | 456 | 5642 | 21509 | |
Some College | 1204 | 7232 | 23569 | |
Assoc. Degree | 206 | 1751 | 7580 | |
Bachelors Degree | 1514 | 9516 | 32045 | |
Higher Degree | 815 | 6165 | 16361 | |
Total Housing Units | 3,178 | 21,795 | 68,831 | |
--Owner-Occupied | 898 | 9,987 | 37,469 | |
--Renter-Occupied | 2,157 | 10,216 | 27,017 | |
Owner-Occupied Values | < 100K | 17 | 377 | 2303 |
100-199K | 289 | 2862 | 11130 | |
200-299K | 272 | 2685 | 11160 | |
300-399K | 219 | 1836 | 6796 | |
400-499K | 27 | 719 | 2387 | |
500K+ | 75 | 1508 | 3692 | |
Total Working Age Population | 5,477 | 39,049 | 137,879 | |
In Work Force | 4,539 | 28,284 | 93,983 | |
Not In Work Force | 937 | 10,765 | 43,896 | |
Workforce Employed | 4,440 | 27,227 | 90,053 | |
Workforce Unemployed | 99 | 982 | 3,690 | |
Civlian Workforce | 4,539 | 28,210 | 93,743 | |
Military Workforce | 0 | 74 | 240 | |
Total Households | 3,056 | 20,203 | 64,487 | |
Family Households | 1,234 | 11,121 | 40,342 | |
Non-Family Households | 1,821 | 9,082 | 24,144 | |
Married Couple | 675 | 7,740 | 29,303 | |
Other Family | 560 | 3,381 | 11,039 | |
Married w/Child | 303 | 3,231 | 12,546 | |
Single Male w/Child | 14 | 254 | 1,004 | |
Single Female w/Child | 306 | 1,273 | 4,219 |
Population Change Last Two Decades - Plus Projection
2000 | % | 2010 | % | 2020 | % | 2030 | |
---|---|---|---|---|---|---|---|
Georgia | 8,186,453 | +18 | 9,687,653 | +12 | 10,833,472 | +13 | 12,292,423 |
Cobb County | 607,751 | +13 | 688,078 | +15 | 790,588 | +19 | 938,747 |
Fulton County | 816,006 | +13 | 920,581 | +19 | 1,099,181 | +18 | 1,300,861 |
Total Working Age Population:
Total Households:
Total Working Age Population:
Total Households:
Total Working Age Population:
Total Households: