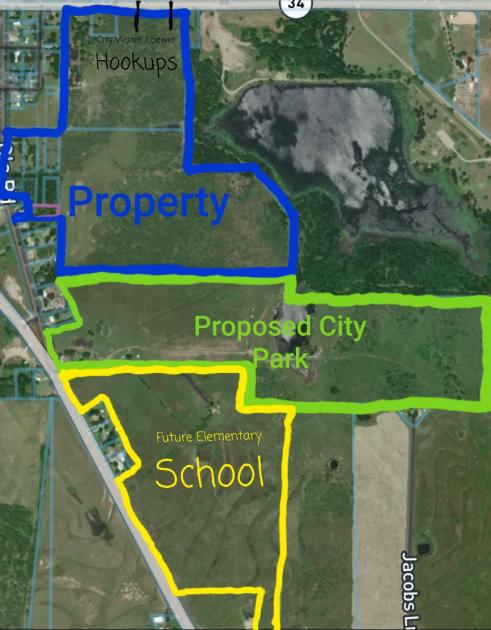
1-Mile | 3-Miles | 5-Miles | ||
---|---|---|---|---|
Total Population | 1,718 | 8,182 | 12,095 | |
Population Median Age | 33 | 36 | 37 | |
Population by Age | 0-9 Yrs | 272 (15%) | 1132 (13%) | 1589 (13%) |
10-19 Yrs | 332 (19%) | 1452 (17%) | 2012 (16%) | |
20-29 Yrs | 258 (15%) | 1033 (12%) | 1407 (11%) | |
30-39 Yrs | 248 (14%) | 1067 (13%) | 1578 (13%) | |
40-49 Yrs | 155 (9%) | 1040 (12%) | 1587 (13%) | |
50-59 Yrs | 206 (11%) | 1067 (13%) | 1656 (13%) | |
60-69 Yrs | 106 (6%) | 686 (8%) | 1199 (9%) | |
70+ Yrs | 140 (8%) | 705 (8%) | 1068 (8%) | |
Median HH Income | $46,010 | $51,040 | $57,184 | |
Total Household Income | < 24K | 136 (28%) | 584 (23%) | 784 (21%) |
25-49K | 132 (27%) | 624 (25%) | 945 (25%) | |
50-74K | 82 (17%) | 369 (15%) | 543 (14%) | |
75-99K | 50 (10%) | 333 (13%) | 510 (13%) | |
100-199K | 58 (12%) | 412 (16%) | 715 (19%) | |
200K+ | 13 (2%) | 113 (4%) | 184 (4%) | |
Highest Education Level | No Diploma | 324 | 1255 | 1755 |
Diploma or GED | 340 | 1740 | 2686 | |
Some College | 186 | 1170 | 1799 | |
Assoc. Degree | 51 | 331 | 579 | |
Bachelors Degree | 43 | 413 | 682 | |
Higher Degree | 30 | 186 | 313 | |
Total Housing Units | 524 | 2,682 | 4,089 | |
--Owner-Occupied | 275 | 1,546 | 2,582 | |
--Renter-Occupied | 197 | 889 | 1,099 | |
Owner-Occupied Values | < 100K | 190 | 805 | 1153 |
100-199K | 48 | 369 | 674 | |
200-299K | 25 | 216 | 415 | |
300-399K | 7 | 91 | 196 | |
400-499K | 1 | 45 | 97 | |
500K+ | 3 | 20 | 48 | |
Total Working Age Population | 1,184 | 5,948 | 9,041 | |
In Work Force | 722 | 3,786 | 5,657 | |
Not In Work Force | 462 | 2,162 | 3,384 | |
Workforce Employed | 665 | 3,548 | 5,329 | |
Workforce Unemployed | 58 | 238 | 328 | |
Civlian Workforce | 722 | 3,786 | 5,657 | |
Military Workforce | 0 | 0 | 0 | |
Total Households | 472 | 2,435 | 3,681 | |
Family Households | 352 | 1,751 | 2,665 | |
Non-Family Households | 119 | 684 | 1,016 | |
Married Couple | 219 | 1,262 | 2,023 | |
Other Family | 134 | 490 | 642 | |
Married w/Child | 138 | 679 | 985 | |
Single Male w/Child | 7 | 61 | 83 | |
Single Female w/Child | 74 | 214 | 261 |
Population Change Last Two Decades - Plus Projection
2000 | % | 2010 | % | 2020 | % | 2030 | |
---|---|---|---|---|---|---|---|
Texas | 20,851,820 | +21 | 25,145,561 | +18 | 29,677,668 | +18 | 34,894,452 |
Kaufman County | 71,313 | +45 | 103,350 | +21 | 125,134 | +22 | 152,682 |
Total Working Age Population:
Total Households:
Total Working Age Population:
Total Households:
Total Working Age Population:
Total Households: