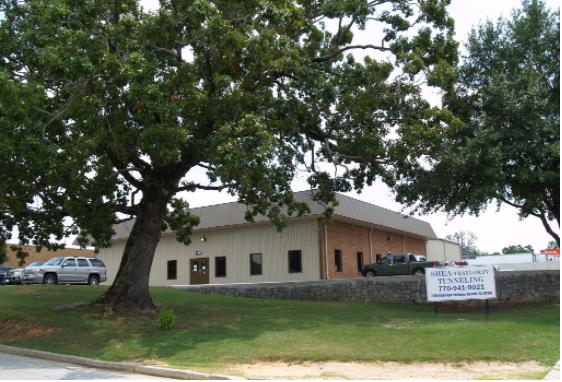
1-Mile | 3-Miles | 5-Miles | ||
---|---|---|---|---|
Total Population | 8,089 | 46,173 | 114,147 | |
Population Median Age | 33 | 33 | 35 | |
Population by Age | 0-9 Yrs | 1304 (16%) | 7541 (16%) | 17967 (15%) |
10-19 Yrs | 1062 (13%) | 6384 (13%) | 15595 (13%) | |
20-29 Yrs | 1295 (16%) | 7249 (15%) | 16187 (14%) | |
30-39 Yrs | 1204 (14%) | 7625 (16%) | 16999 (14%) | |
40-49 Yrs | 1421 (17%) | 6753 (14%) | 17171 (15%) | |
50-59 Yrs | 955 (11%) | 5133 (11%) | 14473 (12%) | |
60-69 Yrs | 529 (6%) | 3478 (7%) | 9158 (8%) | |
70+ Yrs | 319 (3%) | 2010 (4%) | 6597 (5%) | |
Median HH Income | $45,799 | $49,465 | $58,426 | |
Total Household Income | < 24K | 618 (19%) | 2928 (17%) | 6743 (16%) |
25-49K | 1249 (39%) | 5549 (33%) | 11067 (27%) | |
50-74K | 562 (17%) | 3330 (19%) | 7962 (19%) | |
75-99K | 257 (8%) | 2098 (12%) | 5230 (12%) | |
100-199K | 458 (14%) | 2485 (14%) | 7824 (19%) | |
200K+ | 54 (1%) | 317 (1%) | 1906 (4%) | |
Highest Education Level | No Diploma | 490 | 4328 | 8952 |
Diploma or GED | 1498 | 8033 | 20201 | |
Some College | 1223 | 6401 | 14967 | |
Assoc. Degree | 561 | 2362 | 5728 | |
Bachelors Degree | 784 | 4979 | 14721 | |
Higher Degree | 383 | 2532 | 8303 | |
Total Housing Units | 3,643 | 18,589 | 44,292 | |
--Owner-Occupied | 1,091 | 7,356 | 22,394 | |
--Renter-Occupied | 2,106 | 9,352 | 18,338 | |
Owner-Occupied Values | < 100K | 298 | 2077 | 4941 |
100-199K | 637 | 3860 | 9861 | |
200-299K | 128 | 1019 | 4277 | |
300-399K | 14 | 238 | 2035 | |
400-499K | 2 | 28 | 521 | |
500K+ | 12 | 134 | 759 | |
Total Working Age Population | 6,012 | 34,565 | 86,249 | |
In Work Force | 4,822 | 26,290 | 63,068 | |
Not In Work Force | 1,190 | 8,275 | 23,181 | |
Workforce Employed | 4,437 | 24,363 | 58,950 | |
Workforce Unemployed | 386 | 1,857 | 3,948 | |
Civlian Workforce | 4,822 | 26,220 | 62,898 | |
Military Workforce | 0 | 70 | 171 | |
Total Households | 3,197 | 16,707 | 40,732 | |
Family Households | 1,986 | 11,077 | 27,708 | |
Non-Family Households | 1,211 | 5,631 | 13,024 | |
Married Couple | 1,045 | 6,113 | 17,090 | |
Other Family | 941 | 4,964 | 10,618 | |
Married w/Child | 427 | 2,856 | 7,738 | |
Single Male w/Child | 75 | 436 | 1,039 | |
Single Female w/Child | 466 | 2,226 | 4,572 |
Population Change Last Two Decades - Plus Projection
2000 | % | 2010 | % | 2020 | % | 2030 | |
---|---|---|---|---|---|---|---|
Georgia | 8,186,453 | +18 | 9,687,653 | +12 | 10,833,472 | +13 | 12,292,423 |
Cobb County | 607,751 | +13 | 688,078 | +15 | 790,588 | +19 | 938,747 |
Douglas County | 92,174 | +44 | 132,403 | +15 | 151,906 | +20 | 182,157 |
Fulton County | 816,006 | +13 | 920,581 | +19 | 1,099,181 | +18 | 1,300,861 |
Total Working Age Population:
Total Households:
Total Working Age Population:
Total Households:
Total Working Age Population:
Total Households: