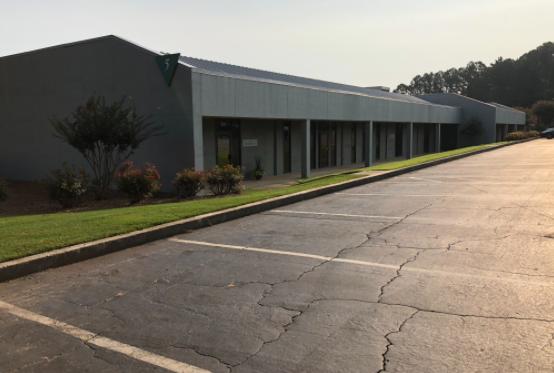
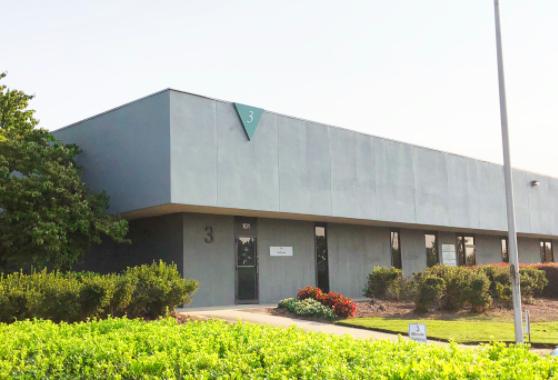
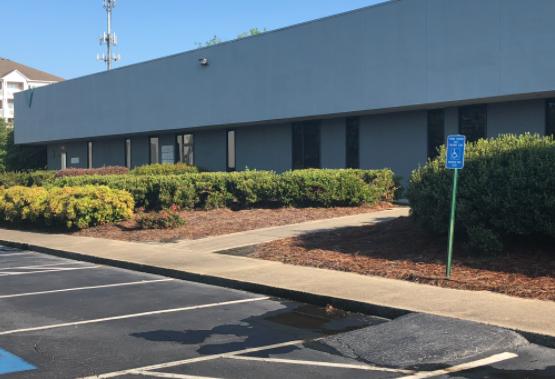
1-Mile | 3-Miles | 5-Miles | ||
---|---|---|---|---|
Total Population | 14,229 | 95,173 | 269,664 | |
Population Median Age | 37 | 37 | 36 | |
Population by Age | 0-9 Yrs | 1904 (13%) | 14463 (15%) | 37504 (13%) |
10-19 Yrs | 1417 (9%) | 10200 (10%) | 29907 (11%) | |
20-29 Yrs | 1859 (13%) | 11808 (12%) | 41939 (15%) | |
30-39 Yrs | 3182 (22%) | 18371 (19%) | 49750 (18%) | |
40-49 Yrs | 2080 (14%) | 12902 (13%) | 36434 (13%) | |
50-59 Yrs | 1652 (11%) | 11098 (11%) | 31663 (11%) | |
60-69 Yrs | 977 (6%) | 7762 (8%) | 22374 (8%) | |
70+ Yrs | 1157 (8%) | 8569 (9%) | 20093 (7%) | |
Median HH Income | $75,607 | $87,529 | $74,735 | |
Total Household Income | < 24K | 847 (12%) | 4639 (11%) | 14881 (13%) |
25-49K | 1405 (20%) | 6529 (16%) | 22967 (20%) | |
50-74K | 1154 (16%) | 5763 (14%) | 18392 (16%) | |
75-99K | 1065 (15%) | 5487 (13%) | 13478 (12%) | |
100-199K | 1550 (22%) | 10234 (25%) | 25330 (22%) | |
200K+ | 842 (12%) | 6711 (17%) | 17061 (15%) | |
Highest Education Level | No Diploma | 219 | 4691 | 18192 |
Diploma or GED | 1181 | 7944 | 26796 | |
Some College | 1272 | 6685 | 21972 | |
Assoc. Degree | 701 | 2981 | 9539 | |
Bachelors Degree | 4145 | 25082 | 65375 | |
Higher Degree | 2880 | 19121 | 44823 | |
Total Housing Units | 7,562 | 43,040 | 122,532 | |
--Owner-Occupied | 3,018 | 20,200 | 52,807 | |
--Renter-Occupied | 3,846 | 19,163 | 59,301 | |
Owner-Occupied Values | < 100K | 62 | 435 | 2450 |
100-199K | 676 | 2281 | 7840 | |
200-299K | 447 | 2678 | 6703 | |
300-399K | 552 | 4216 | 9034 | |
400-499K | 649 | 4374 | 9222 | |
500K+ | 632 | 6215 | 17558 | |
Total Working Age Population | 11,359 | 74,173 | 213,392 | |
In Work Force | 8,397 | 52,766 | 157,375 | |
Not In Work Force | 2,962 | 21,407 | 56,018 | |
Workforce Employed | 8,148 | 51,075 | 152,166 | |
Workforce Unemployed | 230 | 1,644 | 5,062 | |
Civlian Workforce | 8,378 | 52,718 | 157,228 | |
Military Workforce | 19 | 48 | 147 | |
Total Households | 6,864 | 39,362 | 112,108 | |
Family Households | 3,195 | 22,948 | 61,253 | |
Non-Family Households | 3,668 | 16,414 | 50,855 | |
Married Couple | 2,462 | 18,647 | 47,400 | |
Other Family | 733 | 4,301 | 13,853 | |
Married w/Child | 1,246 | 9,176 | 22,233 | |
Single Male w/Child | 47 | 714 | 2,334 | |
Single Female w/Child | 354 | 1,550 | 5,200 |
Population Change Last Two Decades - Plus Projection
2000 | % | 2010 | % | 2020 | % | 2030 | |
---|---|---|---|---|---|---|---|
Georgia | 8,186,453 | +18 | 9,687,653 | +12 | 10,833,472 | +13 | 12,292,423 |
Cobb County | 607,751 | +13 | 688,078 | +15 | 790,588 | +19 | 938,747 |
DeKalb County | 665,865 | +4 | 691,893 | +15 | 793,154 | +19 | 944,045 |
Fulton County | 816,006 | +13 | 920,581 | +19 | 1,099,181 | +18 | 1,300,861 |
Gwinnett County | 588,448 | +37 | 805,321 | +21 | 971,145 | +21 | 1,175,358 |
Total Working Age Population:
Total Households:
Total Working Age Population:
Total Households:
Total Working Age Population:
Total Households: