Commercial Land
12350 U.S. 41 Spring Hill, FL 34610
12350 U.S. 41 Spring Hill, FL 34610

Details & Description
Property Highlights
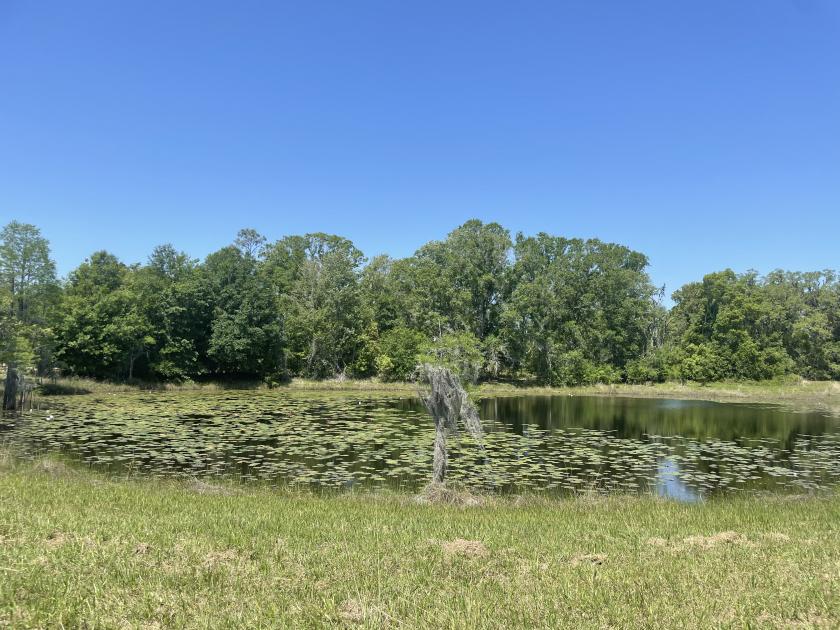
- • 99.88 acres MOL vacant residential land
- • Residential-3 Future Land Use
- • Over 2,360 ft frontage on US Hwy 41
- • Strong demographics in a growing area
- • Located 3/4 miles north of State Road 52
Additional Photos


Listing Agents

Amanda Malhoit
Berkshire Hathaway
O: 813-712-8489
M: 813-751-7556
amalhoit@bhhsflpg.com
Berkshire Hathaway
O: 813-712-8489
M: 813-751-7556
amalhoit@bhhsflpg.com
While we strive to provide the most accurate information, all listing information, and demographic data, is provided by third-parties. As such, MyEListing will not be responsible for the accuracy of the information. It is strongly recommended that you verify all information with the listing agent, and any relevant agencies, prior to making any decisions.


