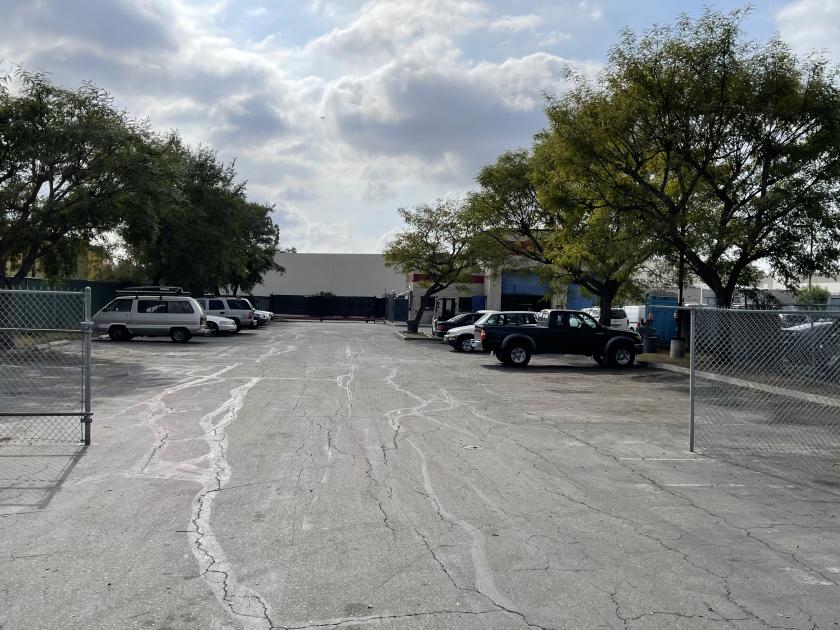
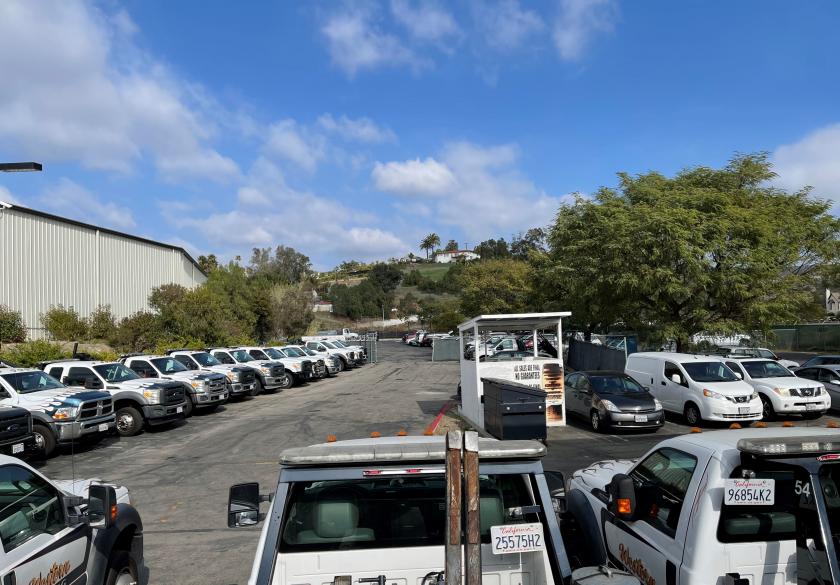
1-Mile | 3-Miles | 5-Miles | ||
---|---|---|---|---|
Total Population | 15,671 | 91,921 | 237,361 | |
Population Median Age | 33 | 37 | 37 | |
Population by Age | 0-9 Yrs | 2569 (16%) | 13239 (14%) | 33770 (14%) |
10-19 Yrs | 2330 (14%) | 12126 (13%) | 32018 (13%) | |
20-29 Yrs | 2499 (15%) | 13070 (14%) | 32828 (13%) | |
30-39 Yrs | 2335 (14%) | 12938 (14%) | 32594 (13%) | |
40-49 Yrs | 2213 (14%) | 11484 (12%) | 30653 (12%) | |
50-59 Yrs | 1681 (10%) | 11531 (12%) | 29775 (12%) | |
60-69 Yrs | 1225 (7%) | 8773 (9%) | 22571 (9%) | |
70+ Yrs | 819 (5%) | 8760 (9%) | 23153 (9%) | |
Median HH Income | $62,059 | $73,101 | $80,573 | |
Total Household Income | < 24K | 655 (14%) | 4116 (13%) | 8977 (11%) |
25-49K | 994 (22%) | 5615 (19%) | 13283 (17%) | |
50-74K | 1071 (24%) | 5440 (18%) | 13587 (17%) | |
75-99K | 376 (8%) | 3568 (12%) | 9533 (12%) | |
100-199K | 1057 (23%) | 8299 (28%) | 22425 (29%) | |
200K+ | 268 (6%) | 2484 (8%) | 8140 (10%) | |
Highest Education Level | No Diploma | 2136 | 9925 | 23658 |
Diploma or GED | 2492 | 12608 | 31355 | |
Some College | 2201 | 14110 | 34785 | |
Assoc. Degree | 620 | 5375 | 13027 | |
Bachelors Degree | 1539 | 12411 | 34673 | |
Higher Degree | 661 | 6060 | 18403 | |
Total Housing Units | 4,648 | 30,924 | 79,915 | |
--Owner-Occupied | 2,298 | 16,778 | 46,702 | |
--Renter-Occupied | 2,124 | 12,744 | 29,242 | |
Owner-Occupied Values | < 100K | 279 | 1004 | 2451 |
100-199K | 167 | 908 | 1922 | |
200-299K | 161 | 882 | 2403 | |
300-399K | 156 | 1351 | 4188 | |
400-499K | 435 | 3274 | 8898 | |
500K+ | 1100 | 9358 | 26841 | |
Total Working Age Population | 11,661 | 71,711 | 184,455 | |
In Work Force | 8,178 | 47,685 | 121,502 | |
Not In Work Force | 3,483 | 24,026 | 62,954 | |
Workforce Employed | 7,765 | 45,540 | 115,099 | |
Workforce Unemployed | 387 | 1,838 | 5,433 | |
Civlian Workforce | 8,152 | 47,378 | 120,532 | |
Military Workforce | 27 | 307 | 969 | |
Total Households | 4,422 | 29,522 | 75,944 | |
Family Households | 3,455 | 21,349 | 55,867 | |
Non-Family Households | 967 | 8,173 | 20,077 | |
Married Couple | 2,546 | 15,863 | 42,463 | |
Other Family | 909 | 5,485 | 13,405 | |
Married w/Child | 1,421 | 7,459 | 19,503 | |
Single Male w/Child | 152 | 865 | 1,750 | |
Single Female w/Child | 246 | 1,697 | 4,673 |
Population Change Last Two Decades - Plus Projection
2000 | % | 2010 | % | 2020 | % | 2030 | |
---|---|---|---|---|---|---|---|
California | 33,871,648 | +10 | 37,253,956 | +9 | 40,467,295 | +8 | 43,631,295 |
San Diego County | 2,813,833 | +10 | 3,095,313 | +10 | 3,390,529 | +6 | 3,608,286 |
Total Working Age Population:
Total Households:
Total Working Age Population:
Total Households:
Total Working Age Population:
Total Households: