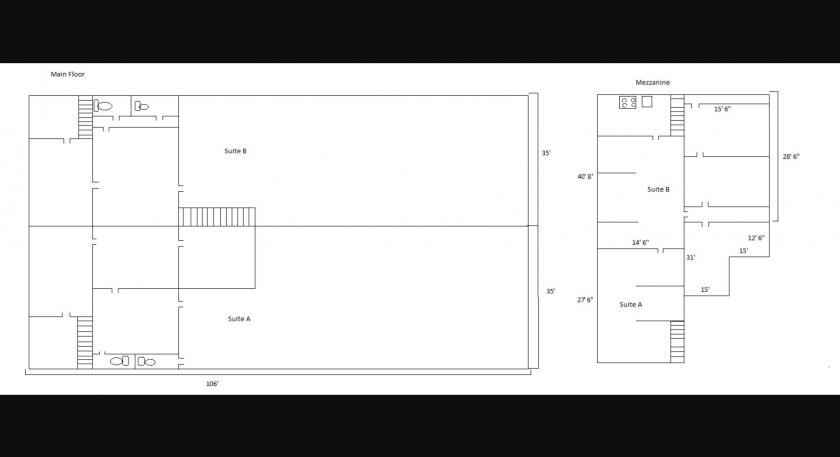
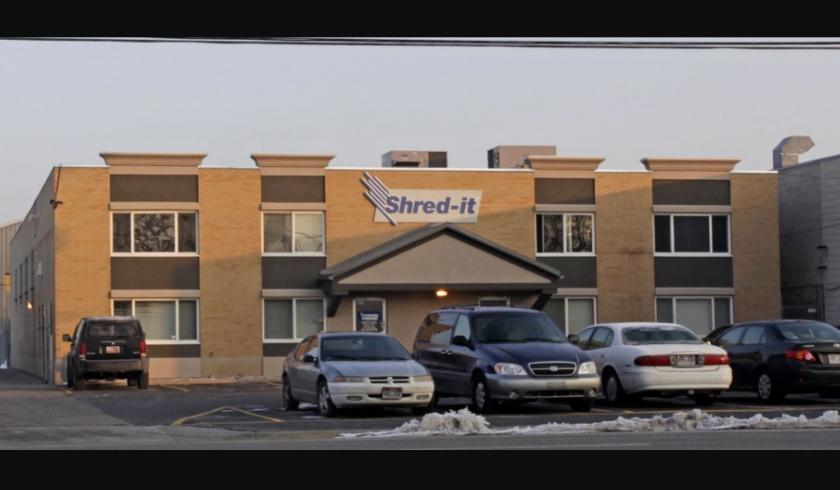
SVN | ALTA COMMERCIAL is proud to present this highly desirable office warehouse space. The office and warehouse spaces are clean and well taken care of. With its central location and secured yard, the space is hard to find and ideal place for a small business to locate and have easy access to all of Salt Lake County from Interstate 15, California Avenue and Highway 201. The office space has been recently updated including new lighting. The office space has a kitchenette and break room.
Suite B $4,036 Per Month Modified Gross
SVN | ALTA COMMERCIAL is proud to present this highly desirable office warehouse space. The office space and warehouse is clean and well taken care of. With its central location and secured yard the space is an ideal place for a small business to locate and have easy access to all of Salt Lake County from Interstate 15, California Avenue and Highway 201. The office space has been recently updated including new lighting. The office space has a kitchenette and break room.
Suite A $2,309 Modified Gross
Suite B $3,014 Modified Gross
No part of this information may be copied, reproduced, repurposed, or screen-captured for any commercial purpose without prior written authorization from MyEListing.
While we strive to provide the most accurate information, all listing information, and demographic data, is provided by third-parties. As such, MyEListing will not be responsible for the accuracy of the information. It is strongly recommended that you verify all information with the listing agent, and any relevant agencies, prior to making any decisions.
What is the asking price for 754 West 1700 South in Salt Lake City?
The asking price for 754 West 1700 South is $9.00 a SF per Year
What is the building size of this commercial Industrial property?
The size of this multi-unit property varies between 5382 - 9505 square feet
What kind of Industrial is the propery at 754 West 1700 South?
The property at 754 West 1700 South Salt Lake City, UT 84104 is listed as a Warehouse Industrial property
What is the population within 1 mile of 754 West 1700 South in Salt Lake City?
The population within 1 mile of 754 West 1700 South Salt Lake City, UT 84104 is 8,654 people.
Who do I contact for questions about 754 West 1700 South?
You should contact the listing agent,
Chet Barber, for any details regarding this commercial listing.