Industrial Properties
1558 West 2225 South Woods Cross, UT 84087
1558 West 2225 South Woods Cross, UT 84087
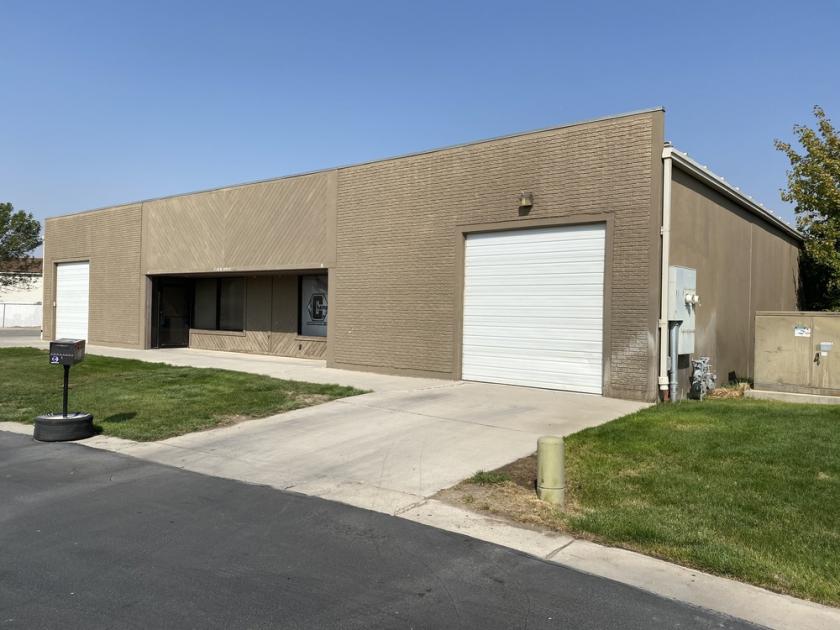
Details & Description
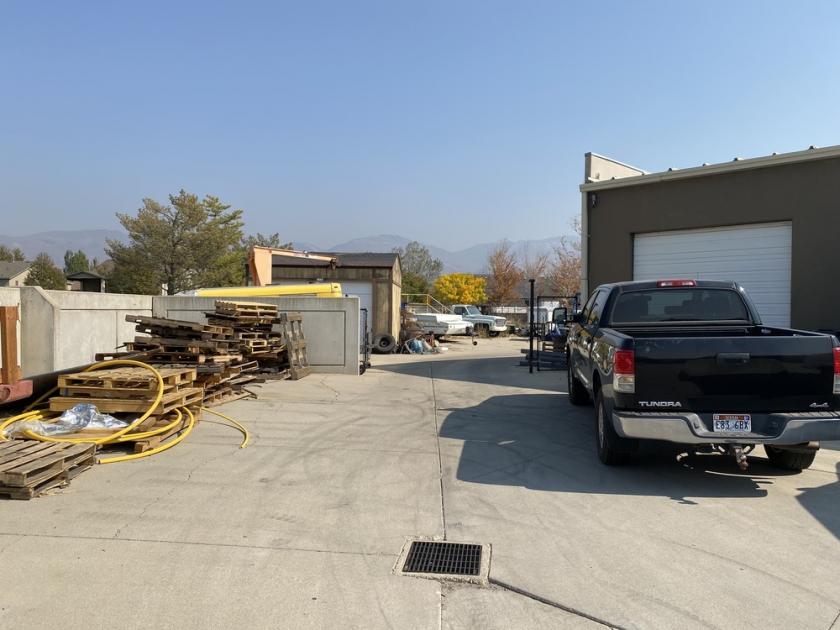
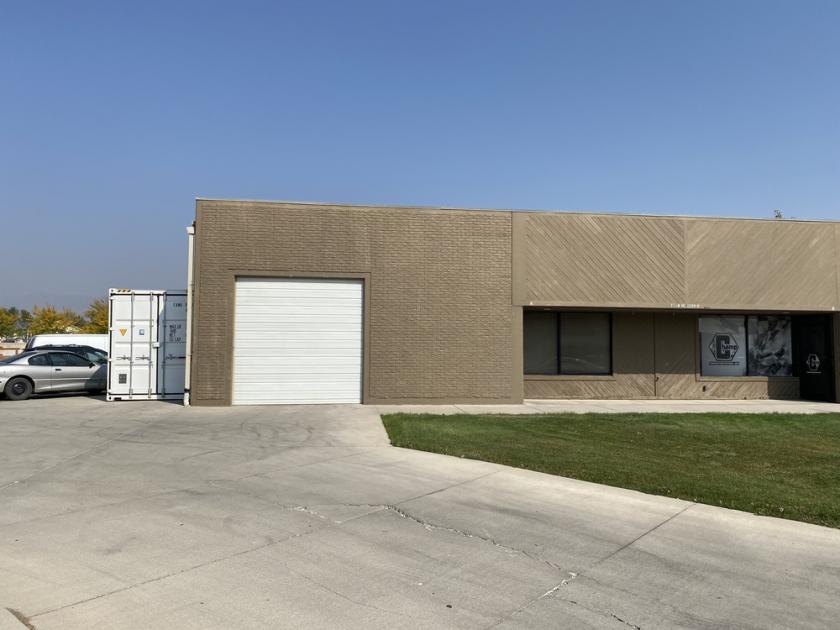
Additional Photos


Listing Agents

Chet Barber
O: 801-783-2064
M: 801-628-9178
chet.barber@svn.com
O: 801-783-2064
M: 801-628-9178
chet.barber@svn.com
Tia Shim Esq
SN Alta Commercial
O: 801-508-2881
tia.shim@svn.com
SN Alta Commercial
O: 801-508-2881
tia.shim@svn.com
While we strive to provide the most accurate information, all listing information, and demographic data, is provided by third-parties. As such, MyEListing will not be responsible for the accuracy of the information. It is strongly recommended that you verify all information with the listing agent, and any relevant agencies, prior to making any decisions.


