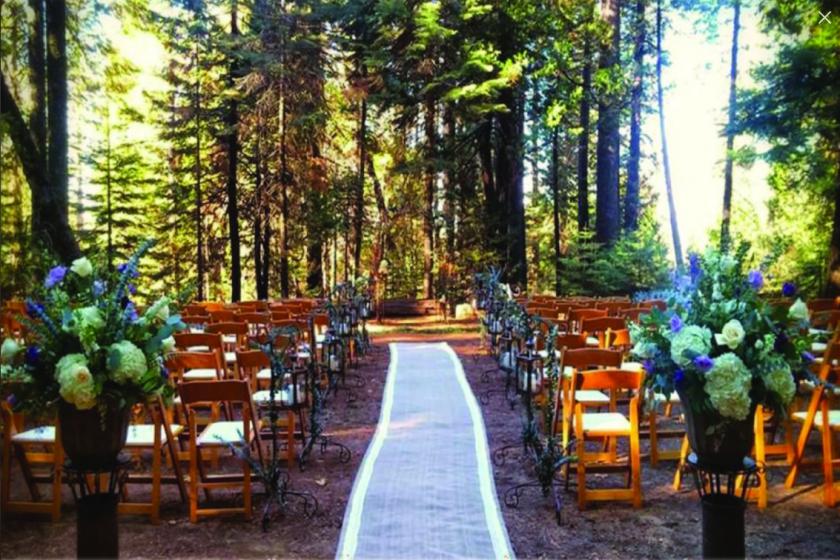
Northgate Commercial Real Estate alongside with Marcus & Millichap have been selected to exclusively market a “Secret Place” – Paradise Springs is located on one hundred secluded acres at 5,200 ft. elevation just off of Highway 41 near the south entrance to Yosemite National Park and is surrounded by the Sierra National Forest. The foothills town of Oakhurst, Bass Lake, the historic Sugar Pine Railroad, Badger Pass Ski Resort, and Yosemite National Park are minutes away. This property defies description – it must be seen to be fully appreciated and to comprehend the underutilized potential this amazing property offers the next ownership. This stunning property features a main lodge, The Villa, that has seven cozy bedrooms and sleeps twenty and comes with an upscale commercial kitchen and dining room that seats fifty guests facing a large stone fireplace. The Bella Pavilion is a large reception and banquet hall with another commercial kitchen and stone fireplace making it the perfect facility for weddings, anniversary, business meetings, or any large function. Additionally, there are four secluded cottages tucked around this mountain hideaway each one has a modern kitchen, full bath, wood burning fireplace, decks, BBQ’s outdoor fire pits and some with lake views.